CodeYourBrand · 2025–2026
TwoContinents Internal dashboard
The internal tool a Dubai travel company runs on: tour management, a financial log for the whole company and an app for guides in the field. Creating a tour went from 30 minutes to 3.
Internal tool · UX Research · Data-heavy · B2B · shadcn
- Context
- TwoContinents runs its guided tours, transfers and finances through an internal dashboard. At CodeYourBrand I designed it: the tours module, the Financial Log and the attendance list for guides.
- My role
- Product Designer: research, user flows, UX/UI, prototypes, usability tests and QA with developers, across the tours module, the Financial Log and the guides' app.
- The Problem
- Everything was manual. Creating a tour took up to 30 minutes for experienced staff and up to 3 hours for new employees, errors were common, and the financial log showed five entries per page.
- Outcome
- Tour creation down from 30 to 3 minutes, new employees doing it without help, and one financial log for the whole company. In usability tests, staff called the new flow more seamless and intuitive. Timed in 1-on-1 usability tests with 7 employees.
01 · What was unclear
The tool didn't match the work, so people had to find their own ways around it to get anything done.
- Tour management was fully manual: slow, error-prone even for experienced staff, and confusing for everyone else.
- Creating one tour took up to 30 minutes for regular users and up to 3 hours for new employees, who needed a senior colleague to walk them through it.
- The same outdated system held the company's finances, in a log nobody could read at a glance.
- Constraints: one designer, and a dashboard that had to ship within one season.
02 · Research
I watched people work before designing anything.
- Who it was for: the TwoContinents team running tours every day, the people who keep the company's books, tour guides in Dubai, and the CodeYourBrand developers building it.
- 1-on-1 interviews with 7 employees, experienced staff and recent hires, combined with watching them run the real flow.
- New hires, who didn't know the shortcuts yet, were stuck the longest.
- I mapped the user flow from interview transcripts before any UI, so engineering had something concrete to estimate.
Result: the goal became a streamlined, mostly automated flow with fewer human errors.
People had built their own shortcuts, notes, side spreadsheets and screenshots, just to get through the flow. That's friction built into the process, not a training problem.
03 · Tours: options and decisions
The old system had to be replaced fast, so every decision had to save time without cutting corners in the flow.
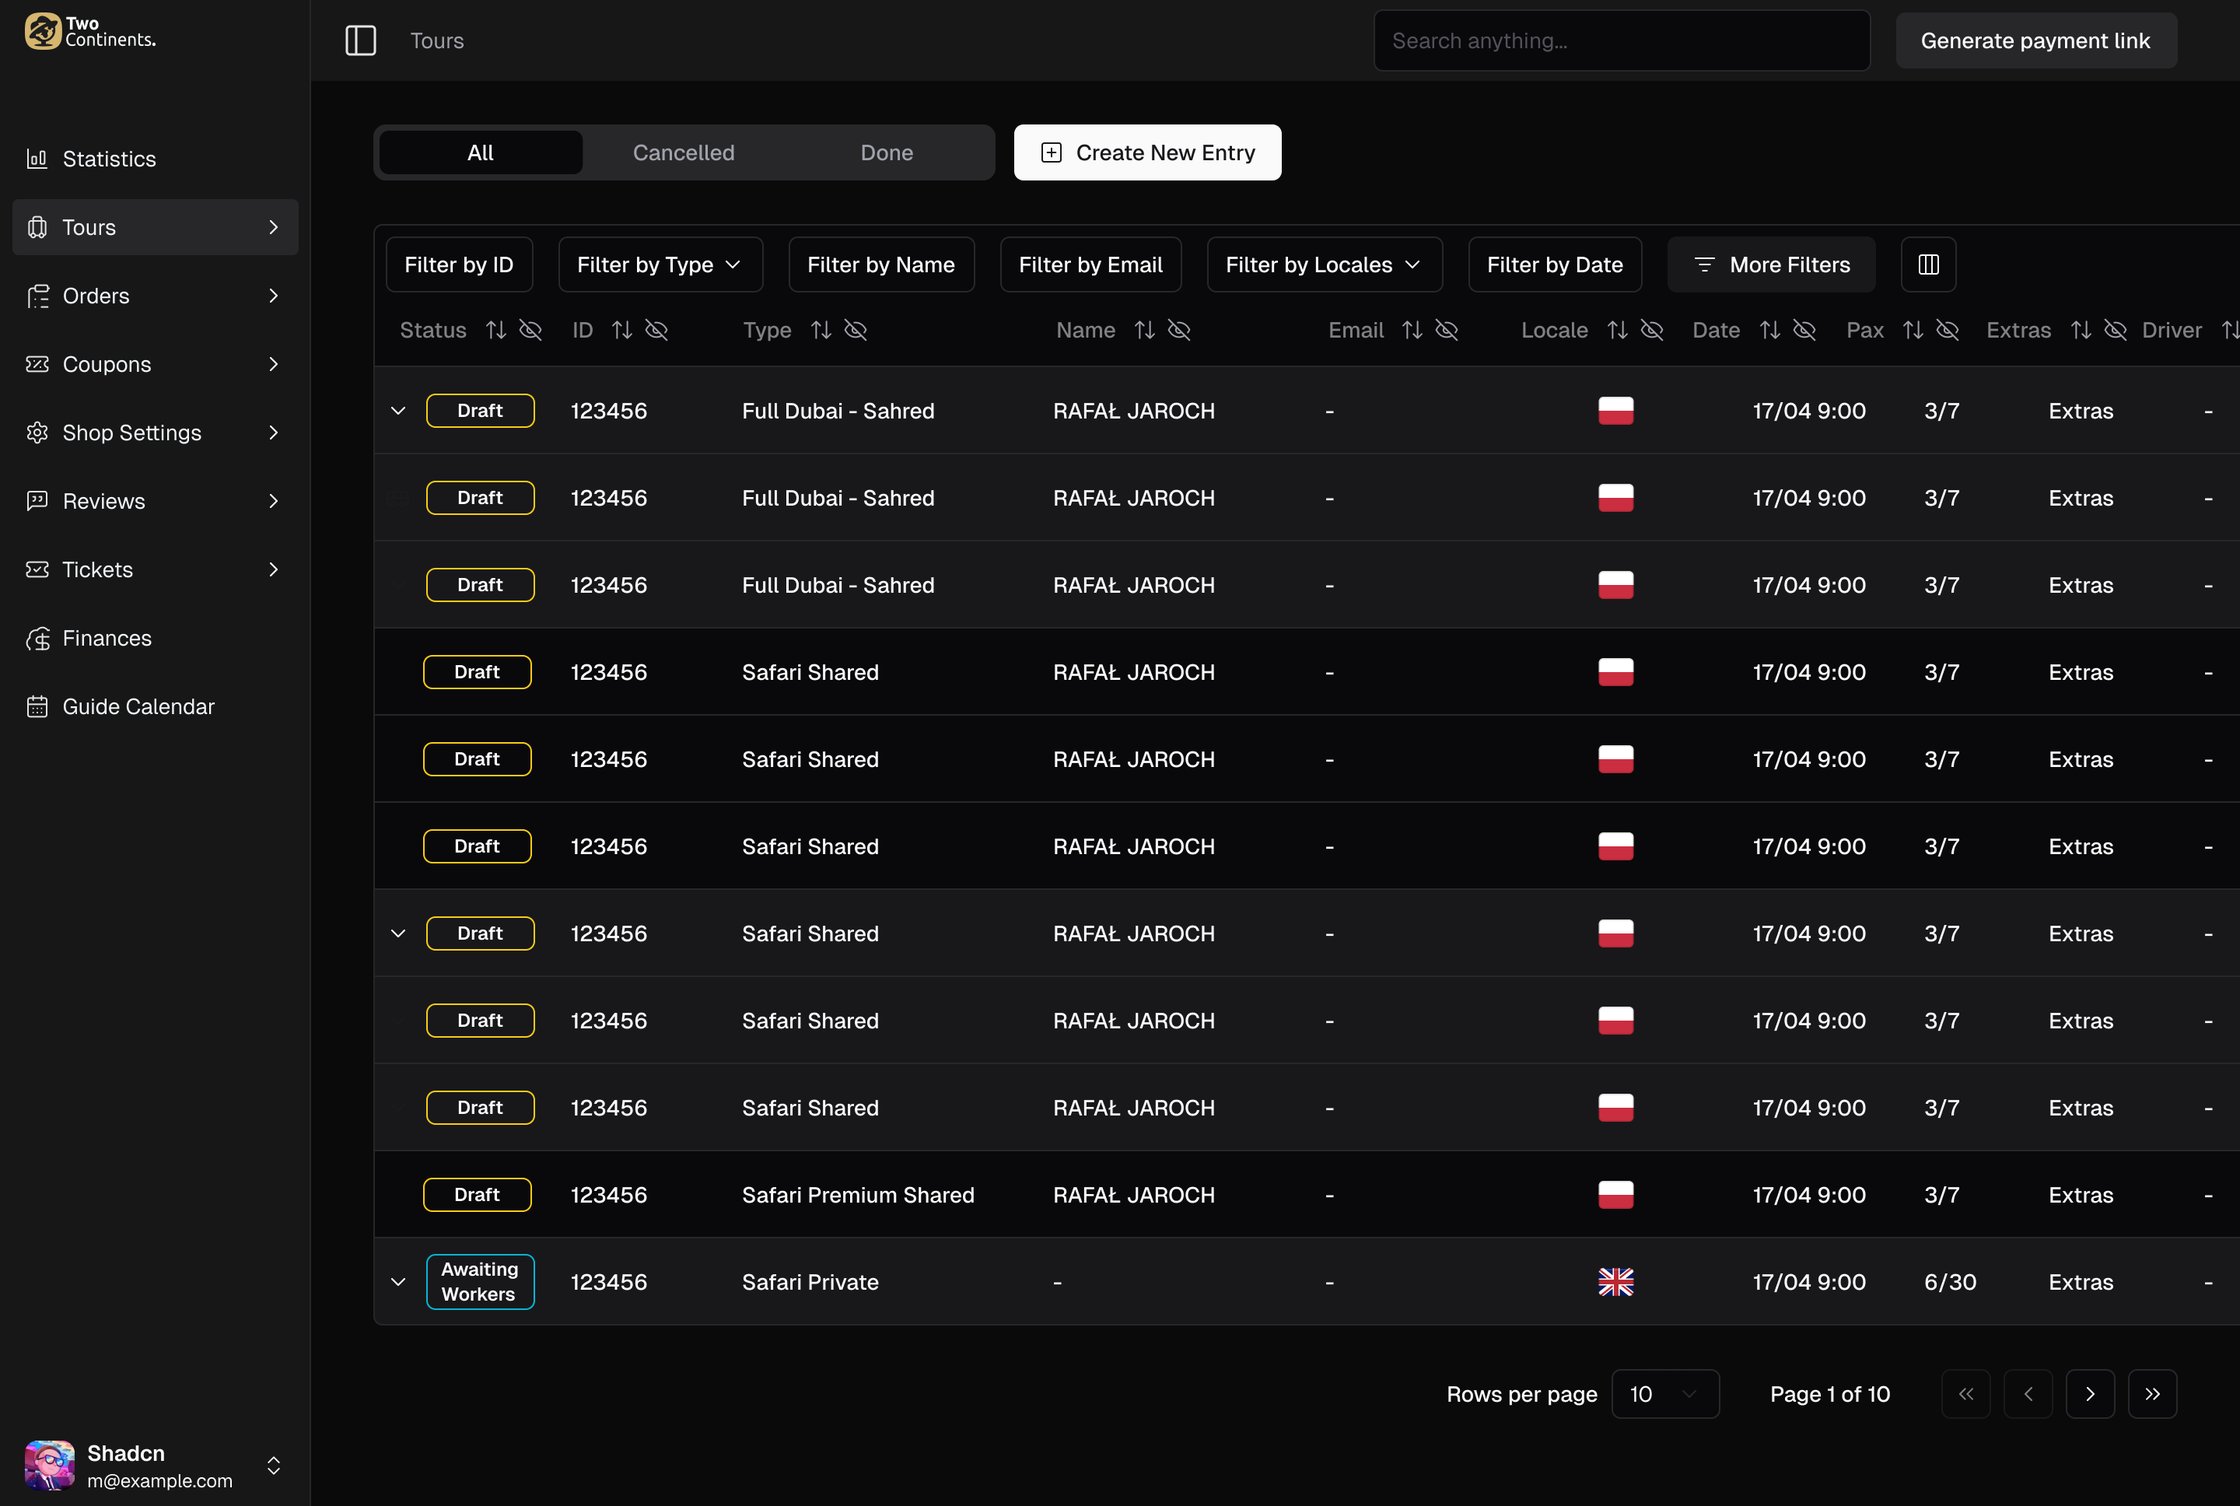
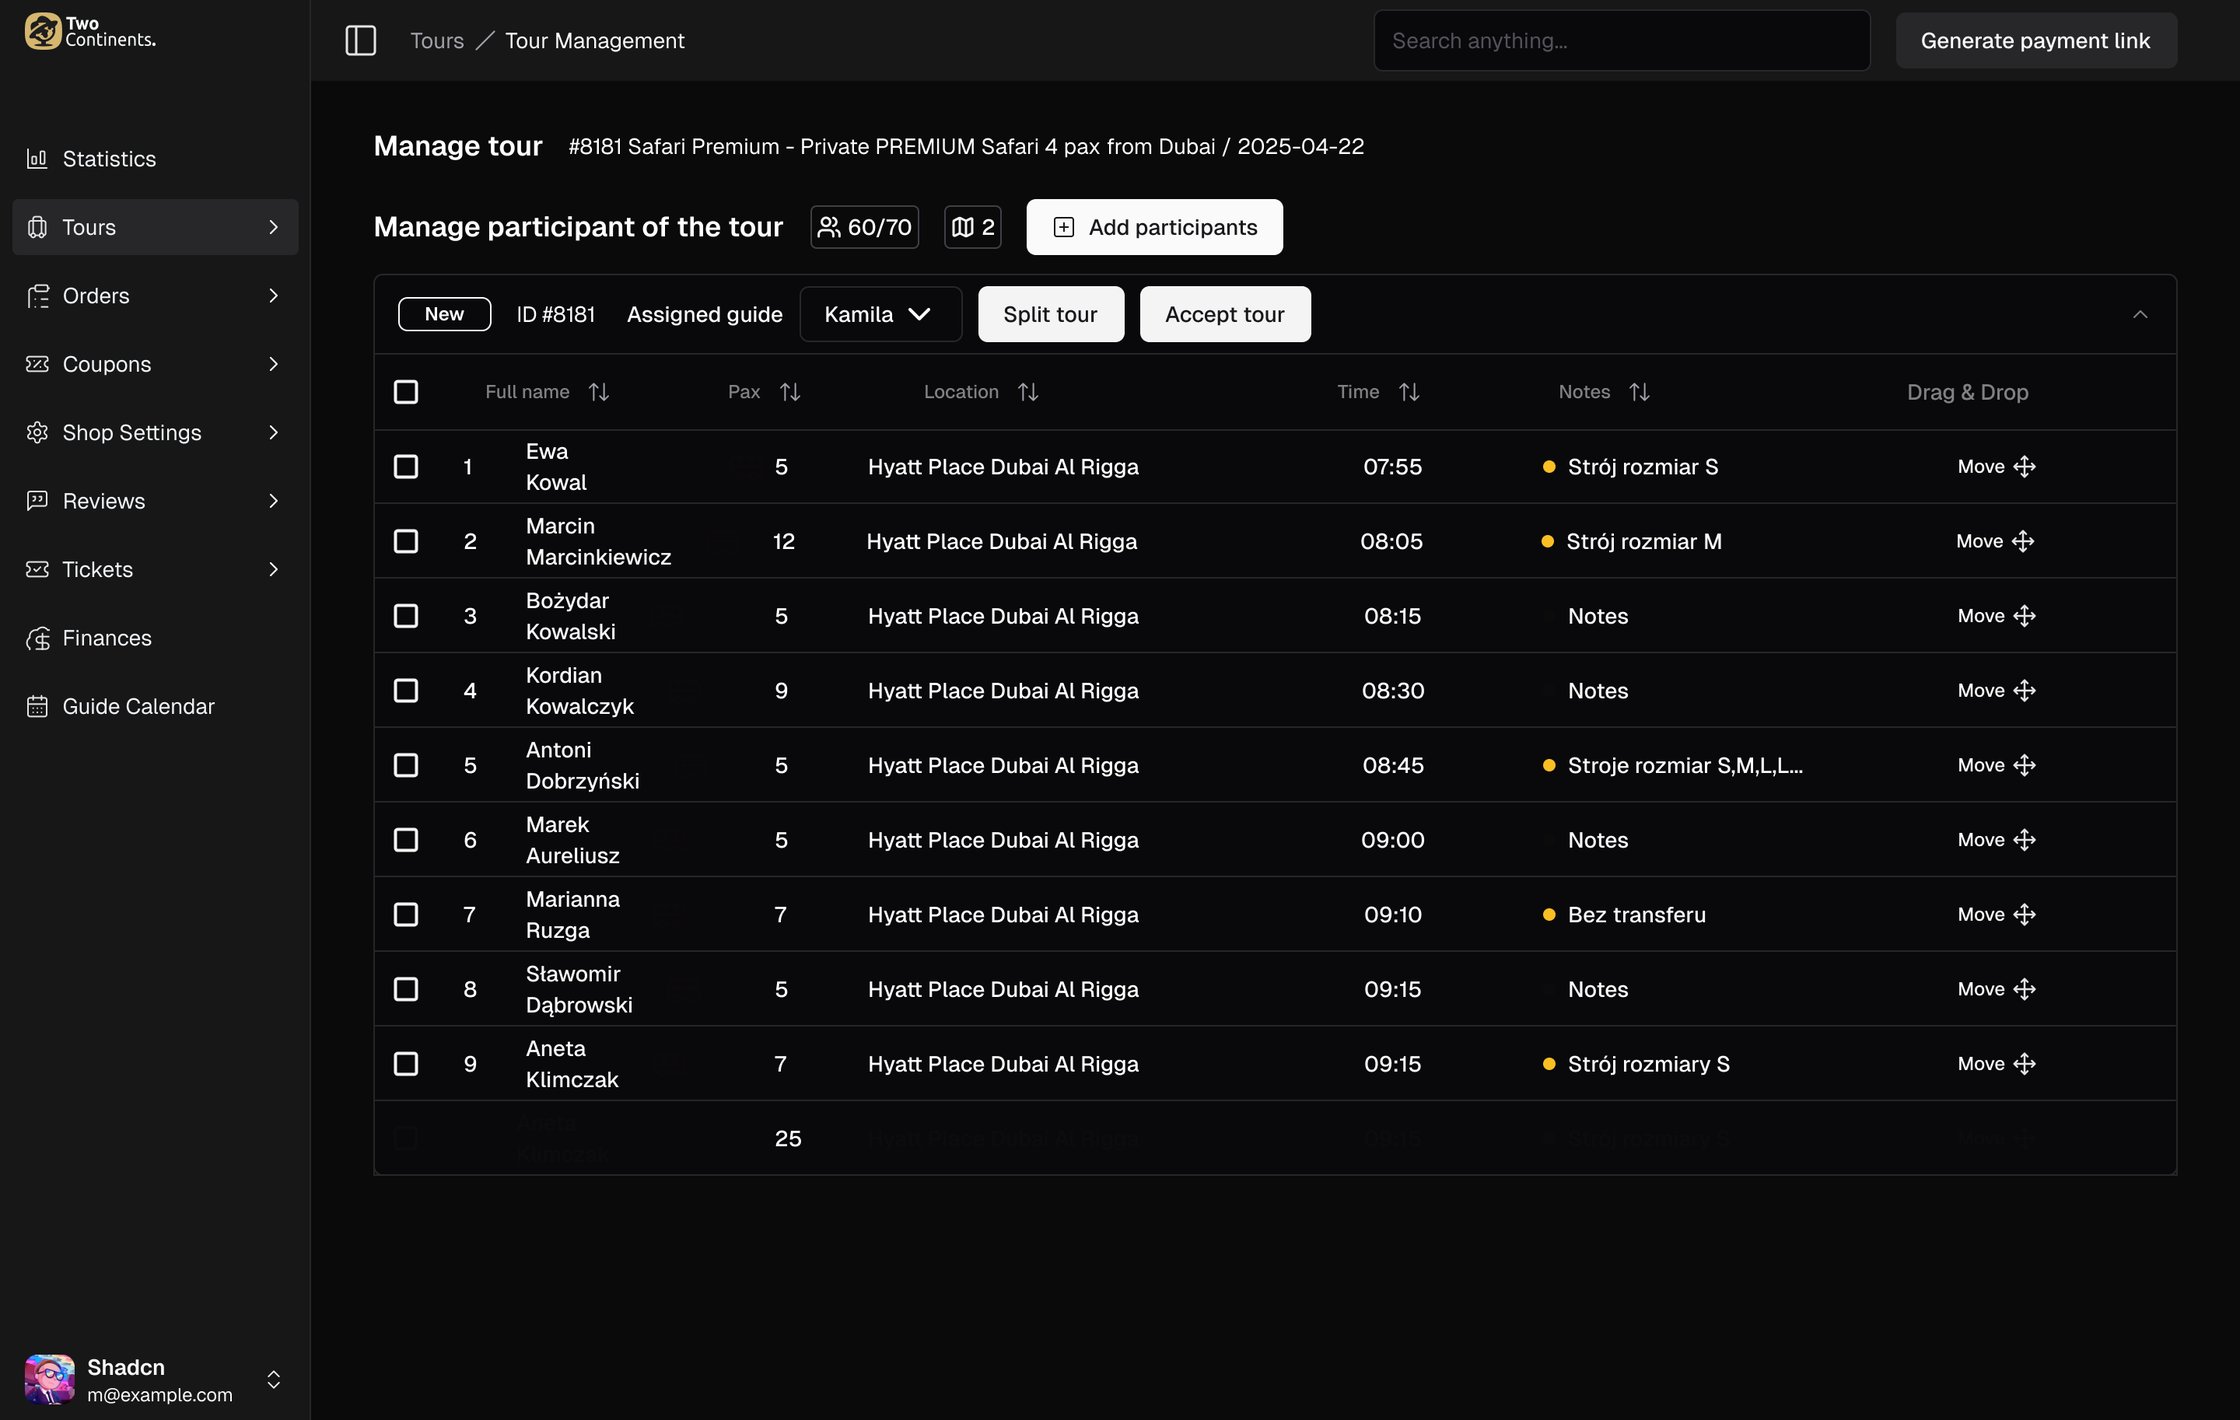
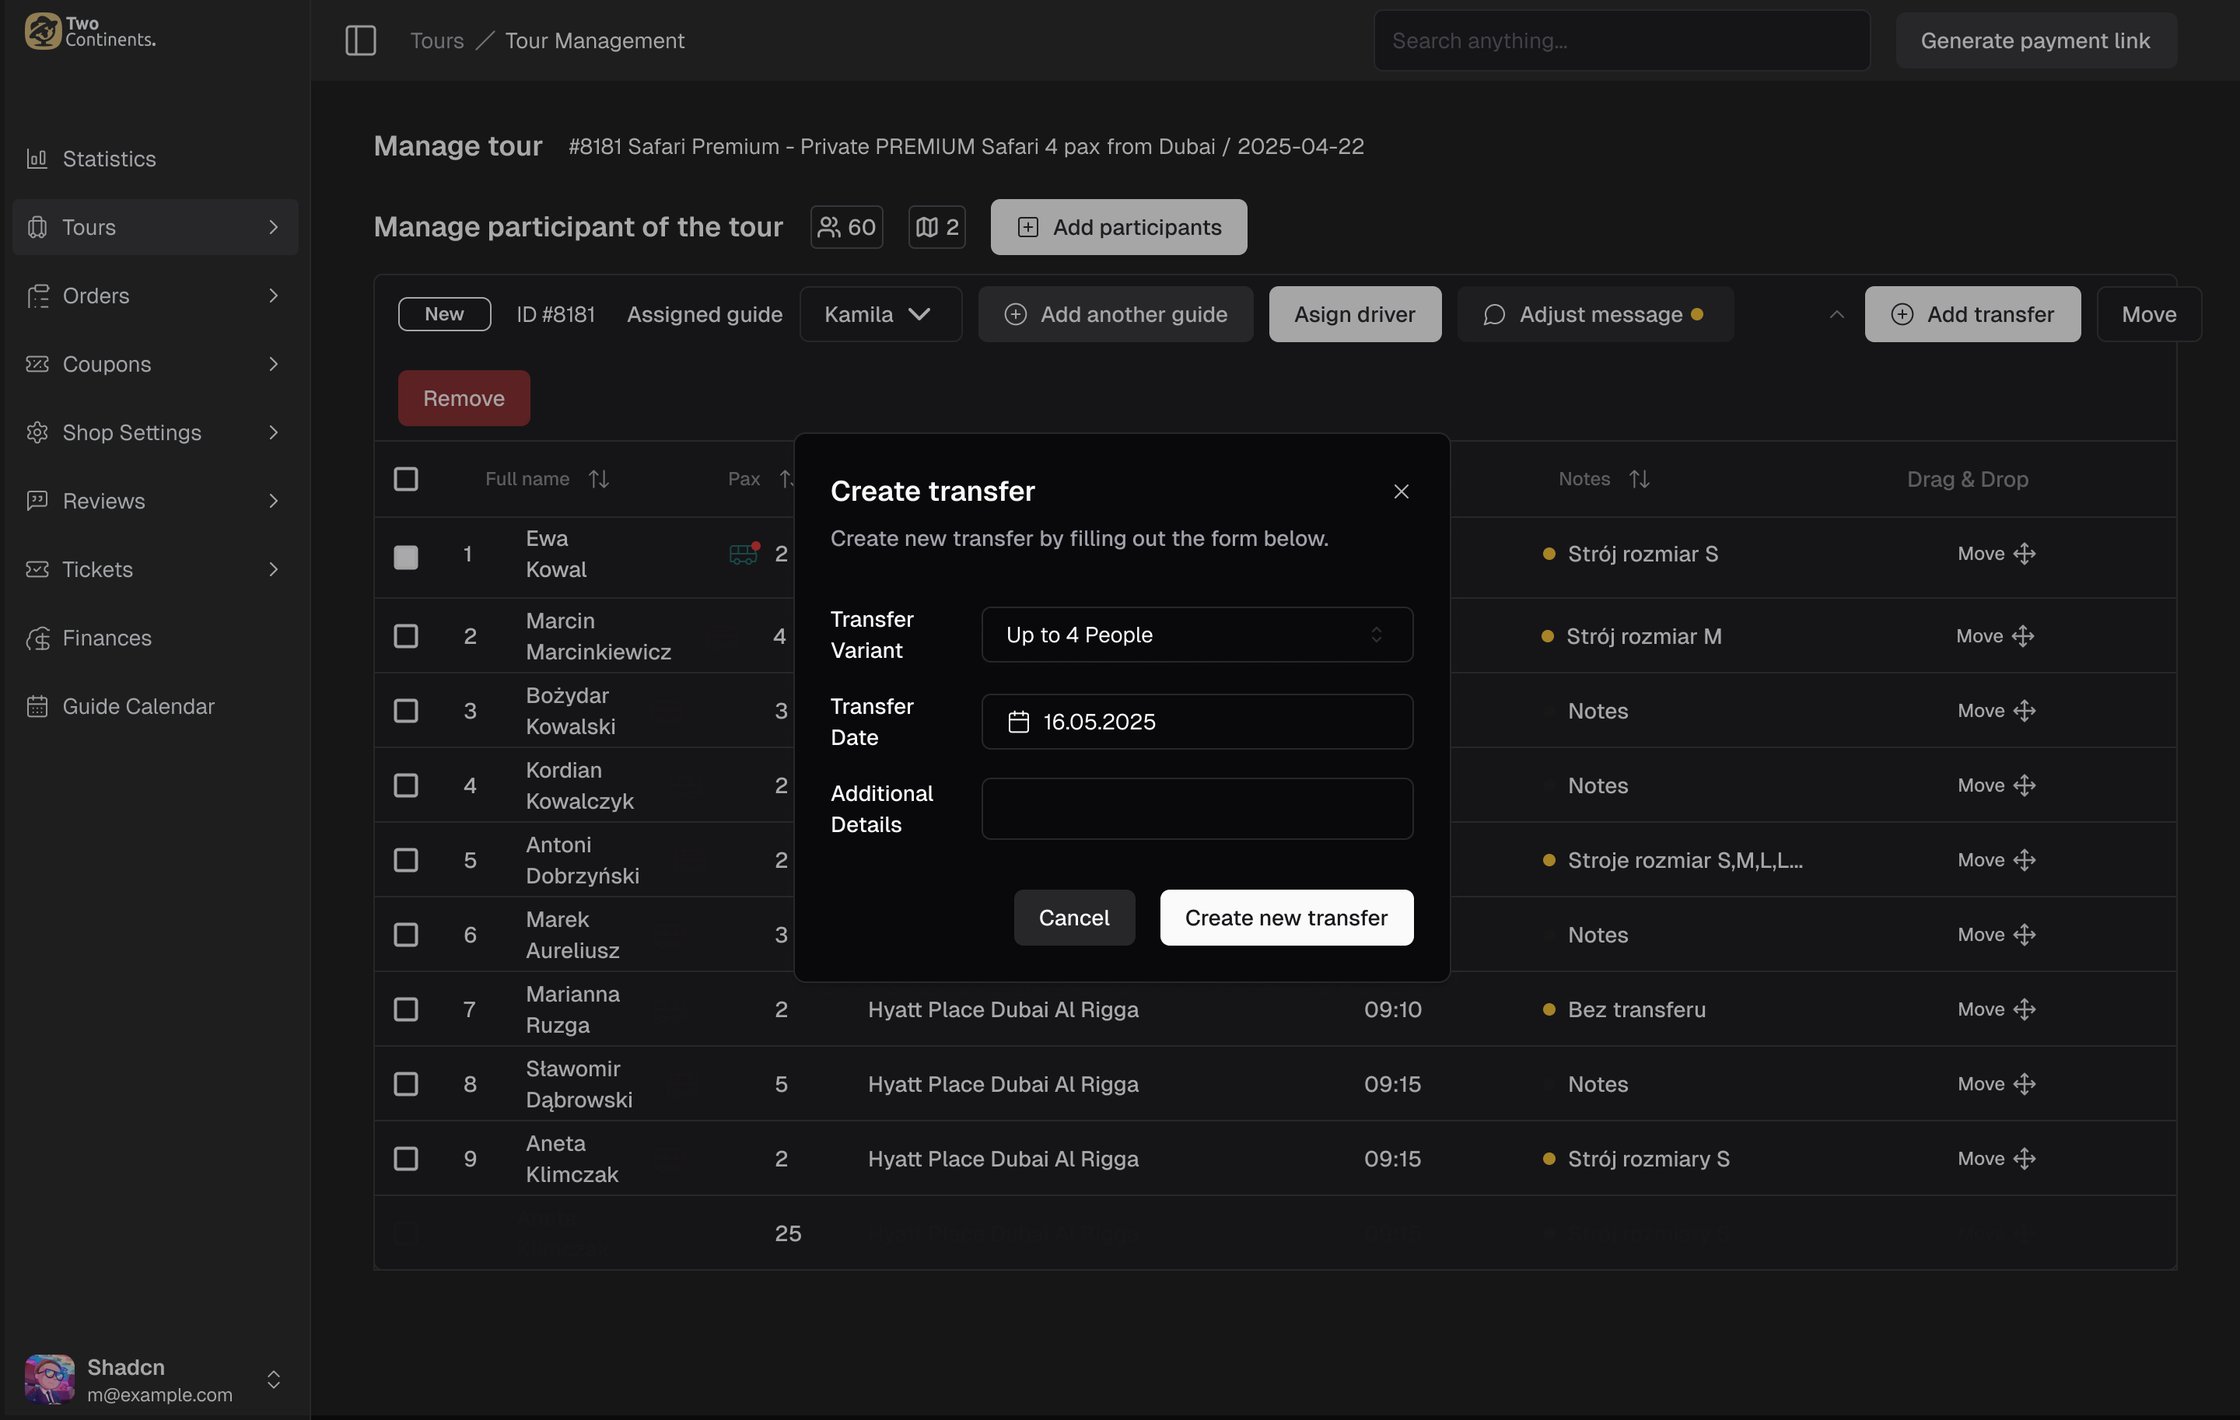
- A clearer, guided flow instead of manual steps, so tasks became more accurate and new employees could follow it on their own.
- MVP scope for tours: only the critical path, create a tour and mark it done. Filters, advanced search and bulk actions waited, because one good flow beats three unfinished ones.
04 · Financial Log: understanding the user
Tours were only half of the dashboard. The other half was the Financial Log: every money movement in the company, in one panel.
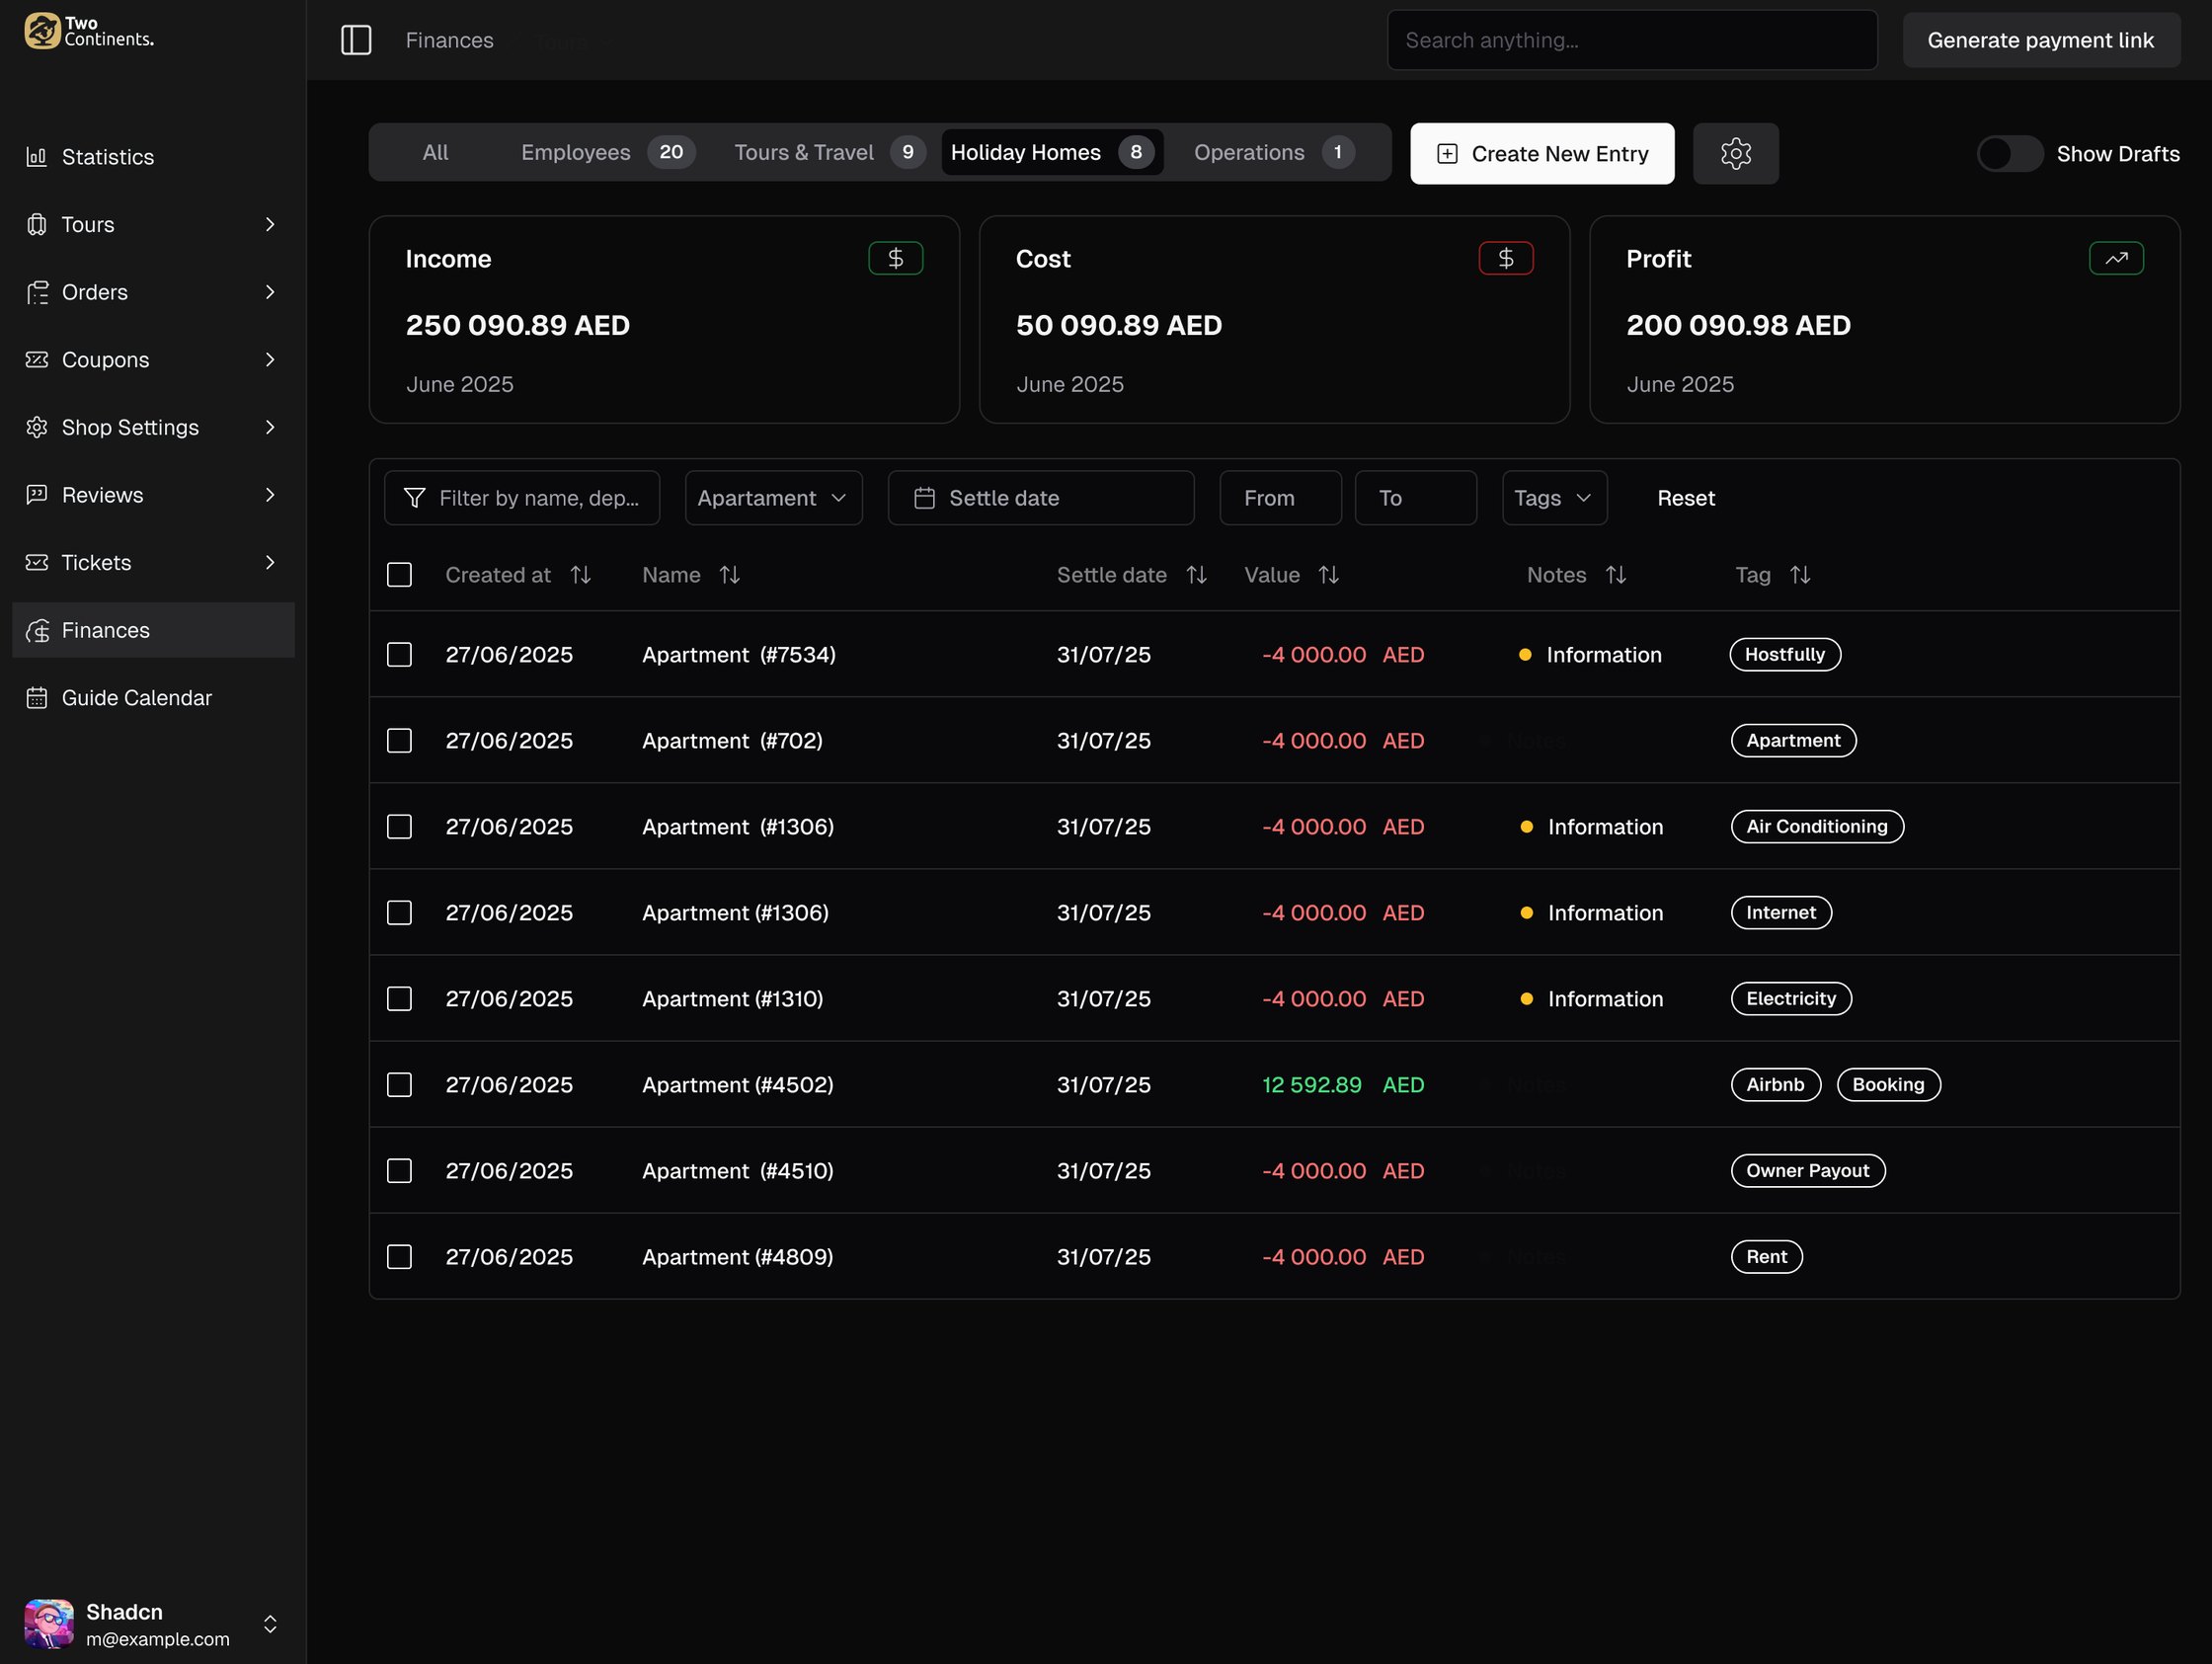
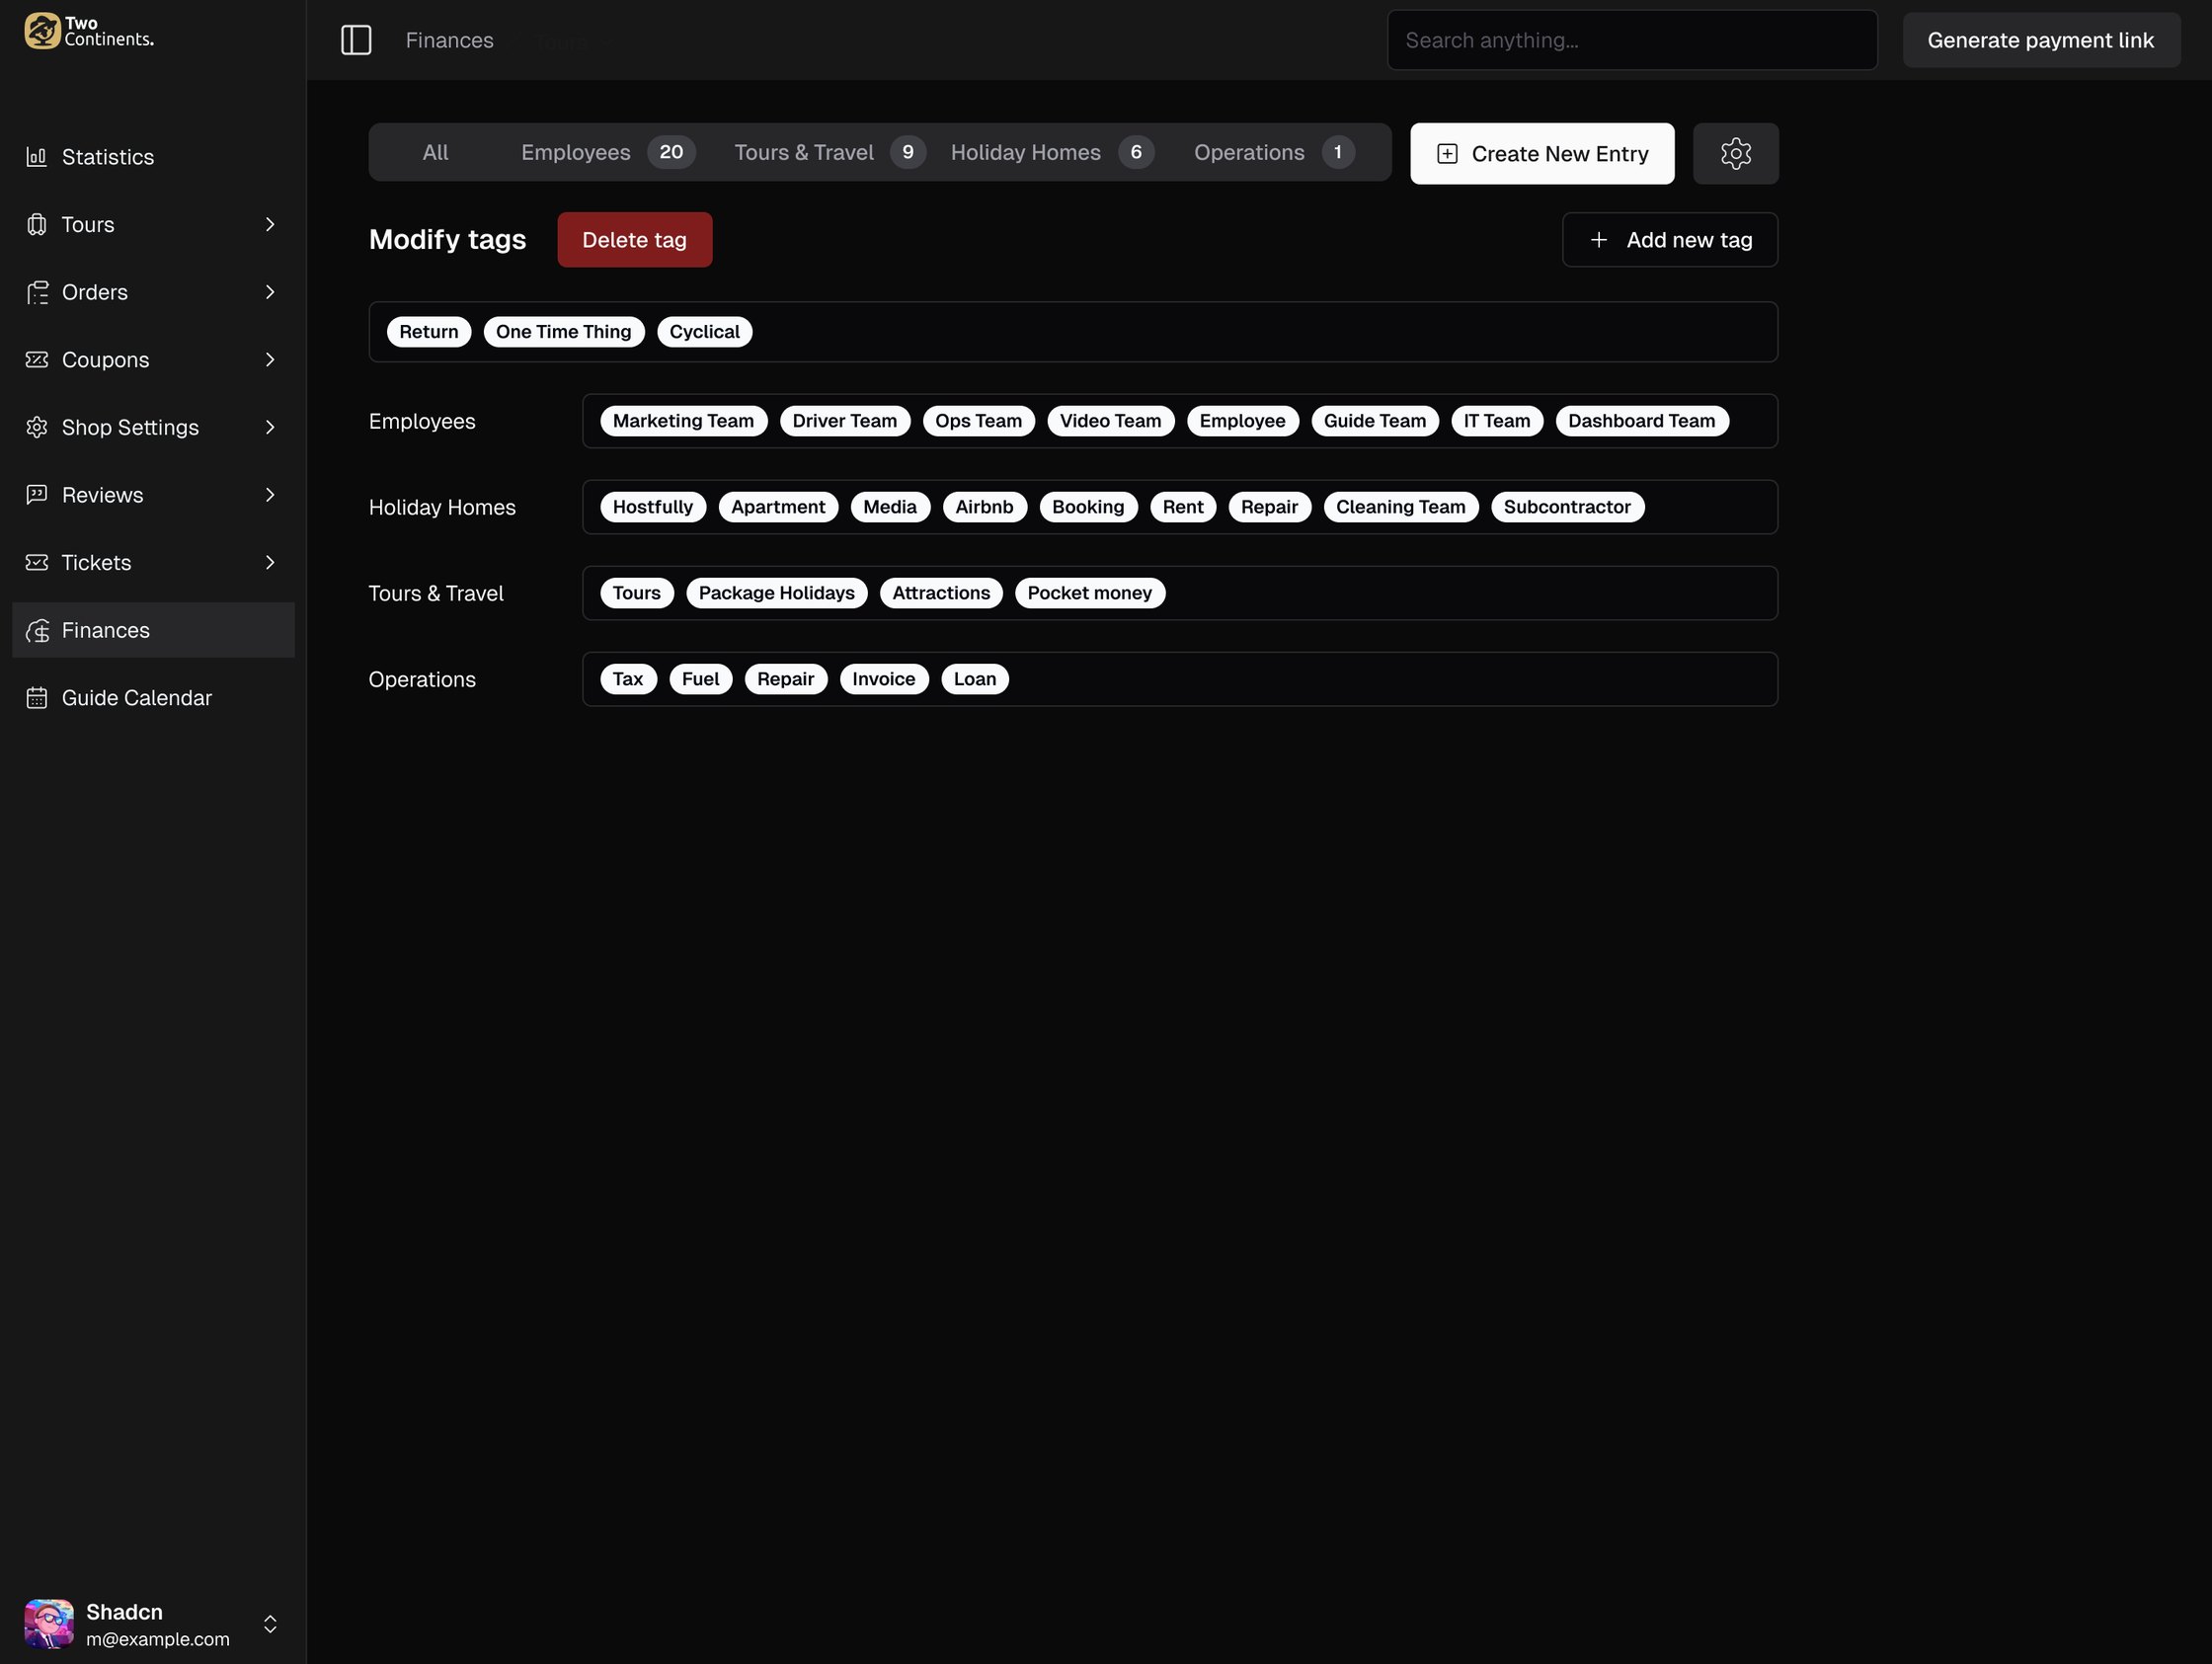
- Scope: the company's whole financial log, split into Employees (payments to the team), Tours & Travel, Holiday Homes (stays rented through Airbnb and Booking) and Operations (tax, fuel, repairs, invoices).
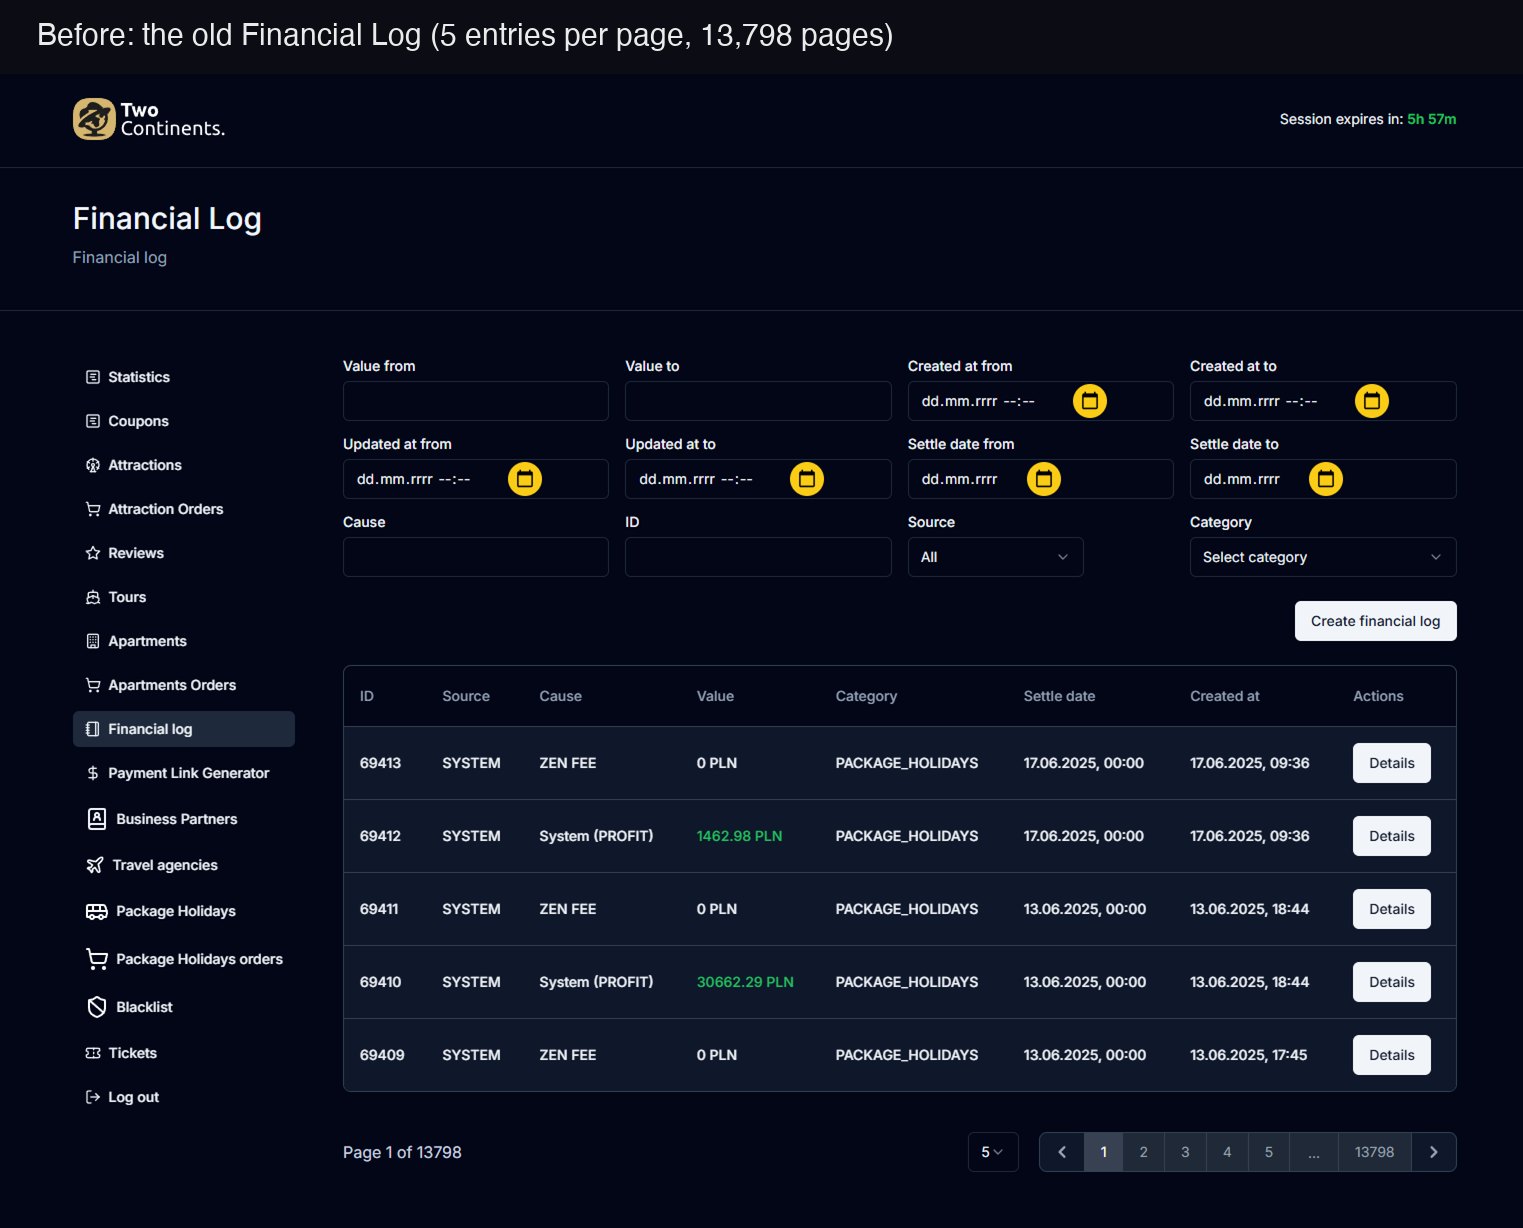
- The starting point: the old log showed five entries per page, 13,798 pages in total, behind a form of twelve filter fields.
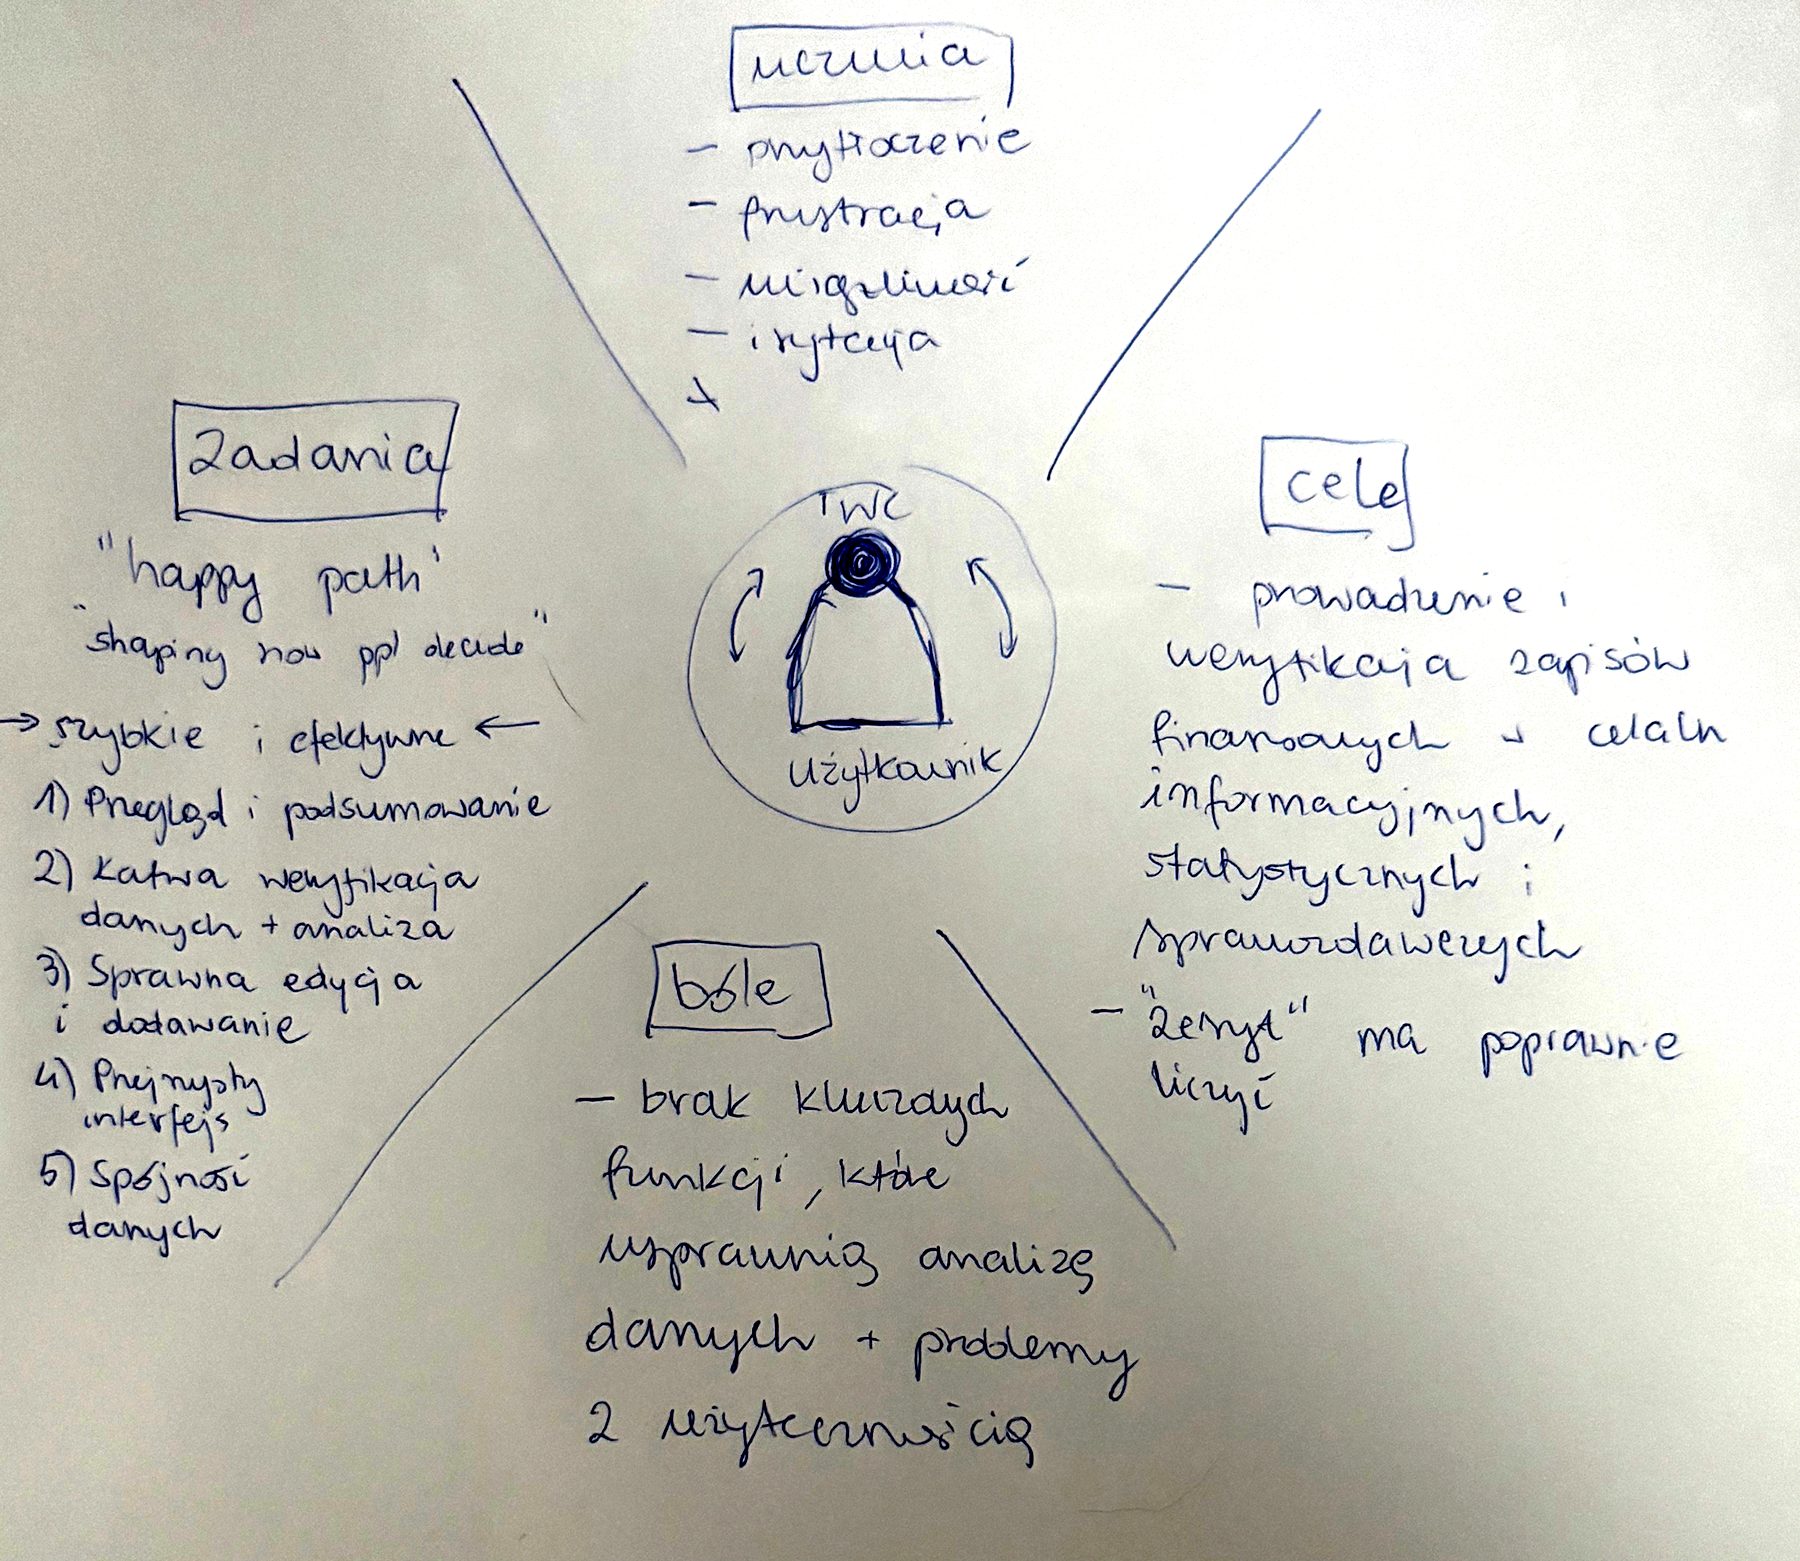
- Before sketching, I mapped the people who keep the books: what they do, what they want, what hurts and how they feel. Their goal: keep and verify financial records for information, statistics and reporting.
- Pains: missing key functions for analysing data, and usability problems. Feelings: overwhelmed, frustrated, irritated.
- Their tasks: a quick overview and summary, easy verification and analysis, smooth editing and adding, a clear interface and consistent data.
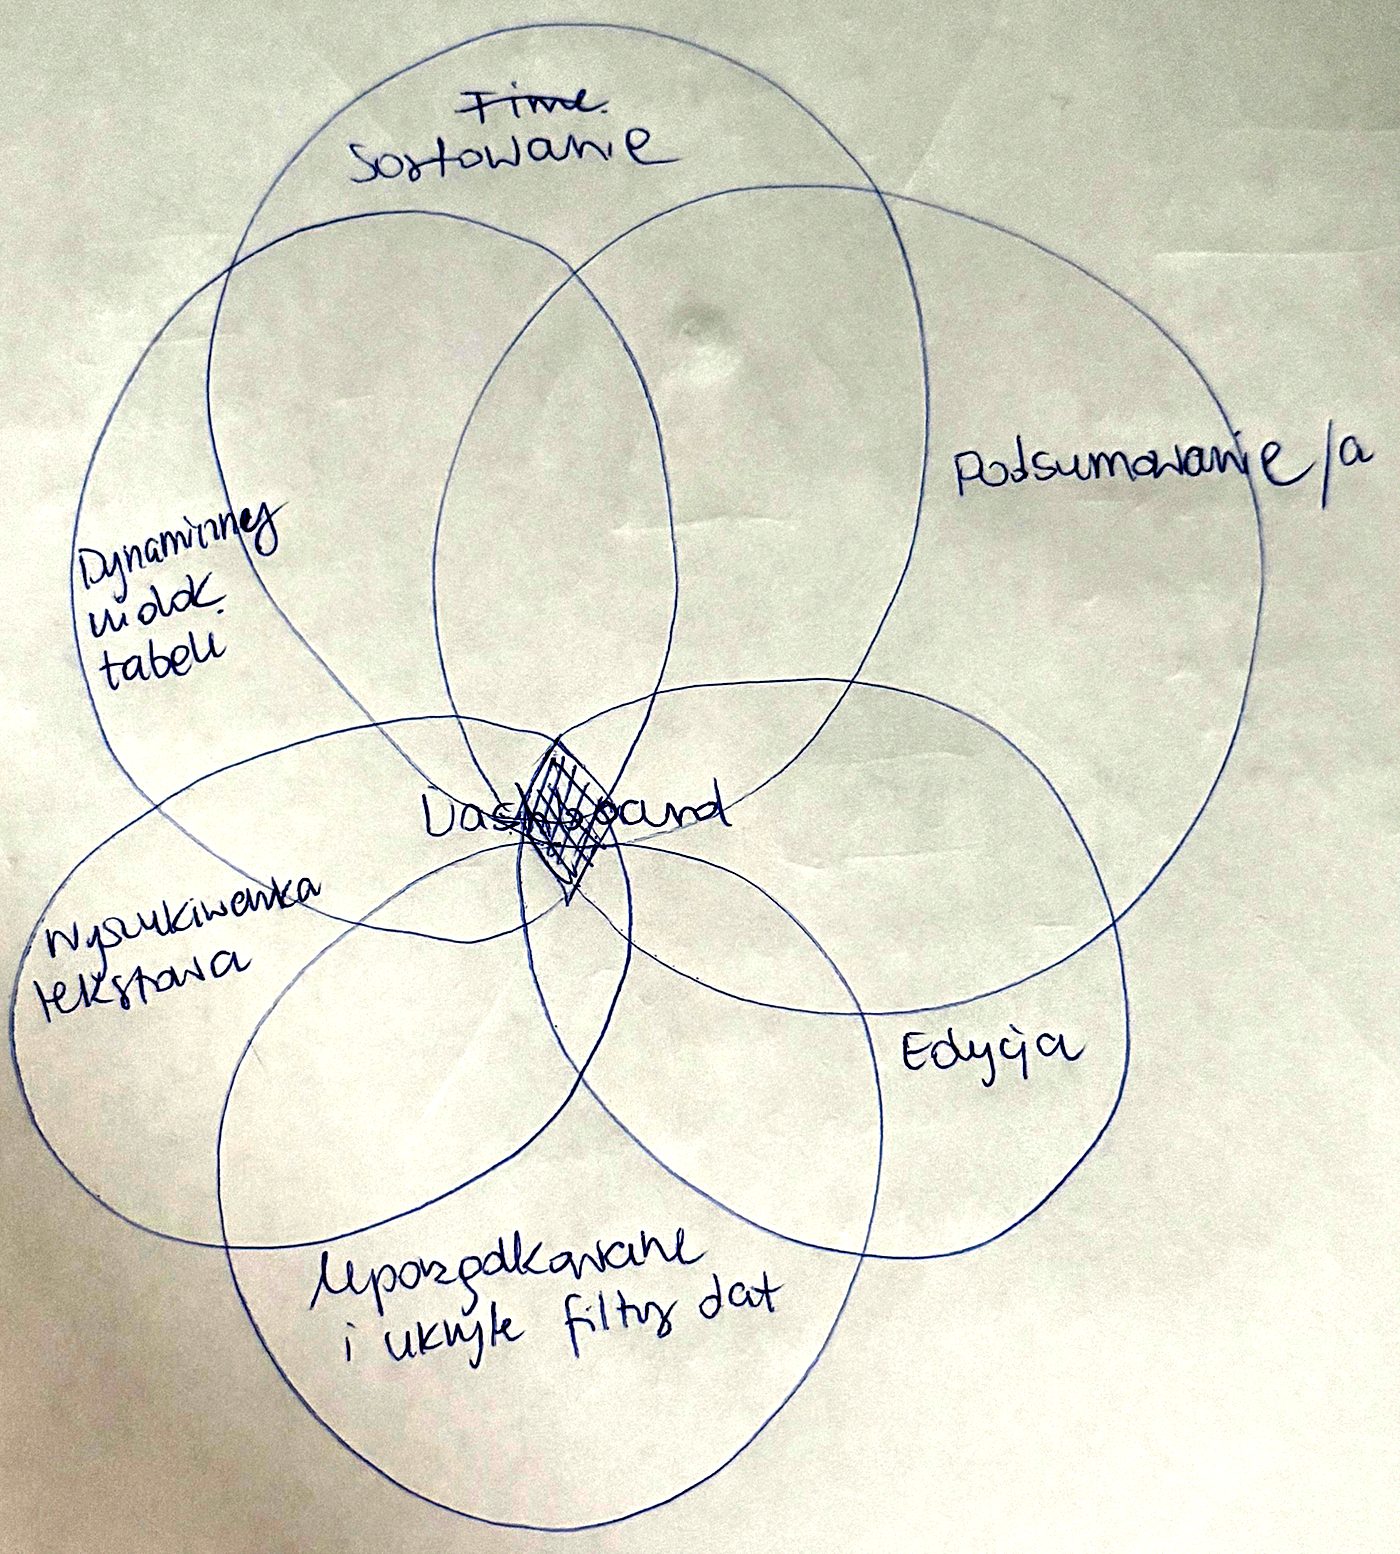
- Then I mapped the capabilities. The dashboard sits where six of them overlap: sorting, summaries, editing, ordered date filters that stay hidden until needed, text search and a dynamic table view.
The goal: everyone on the team works on correct numbers.
05 · Financial Log: sketches and iterations
I iterated on paper with the people who would use it, before a single screen in Figma.
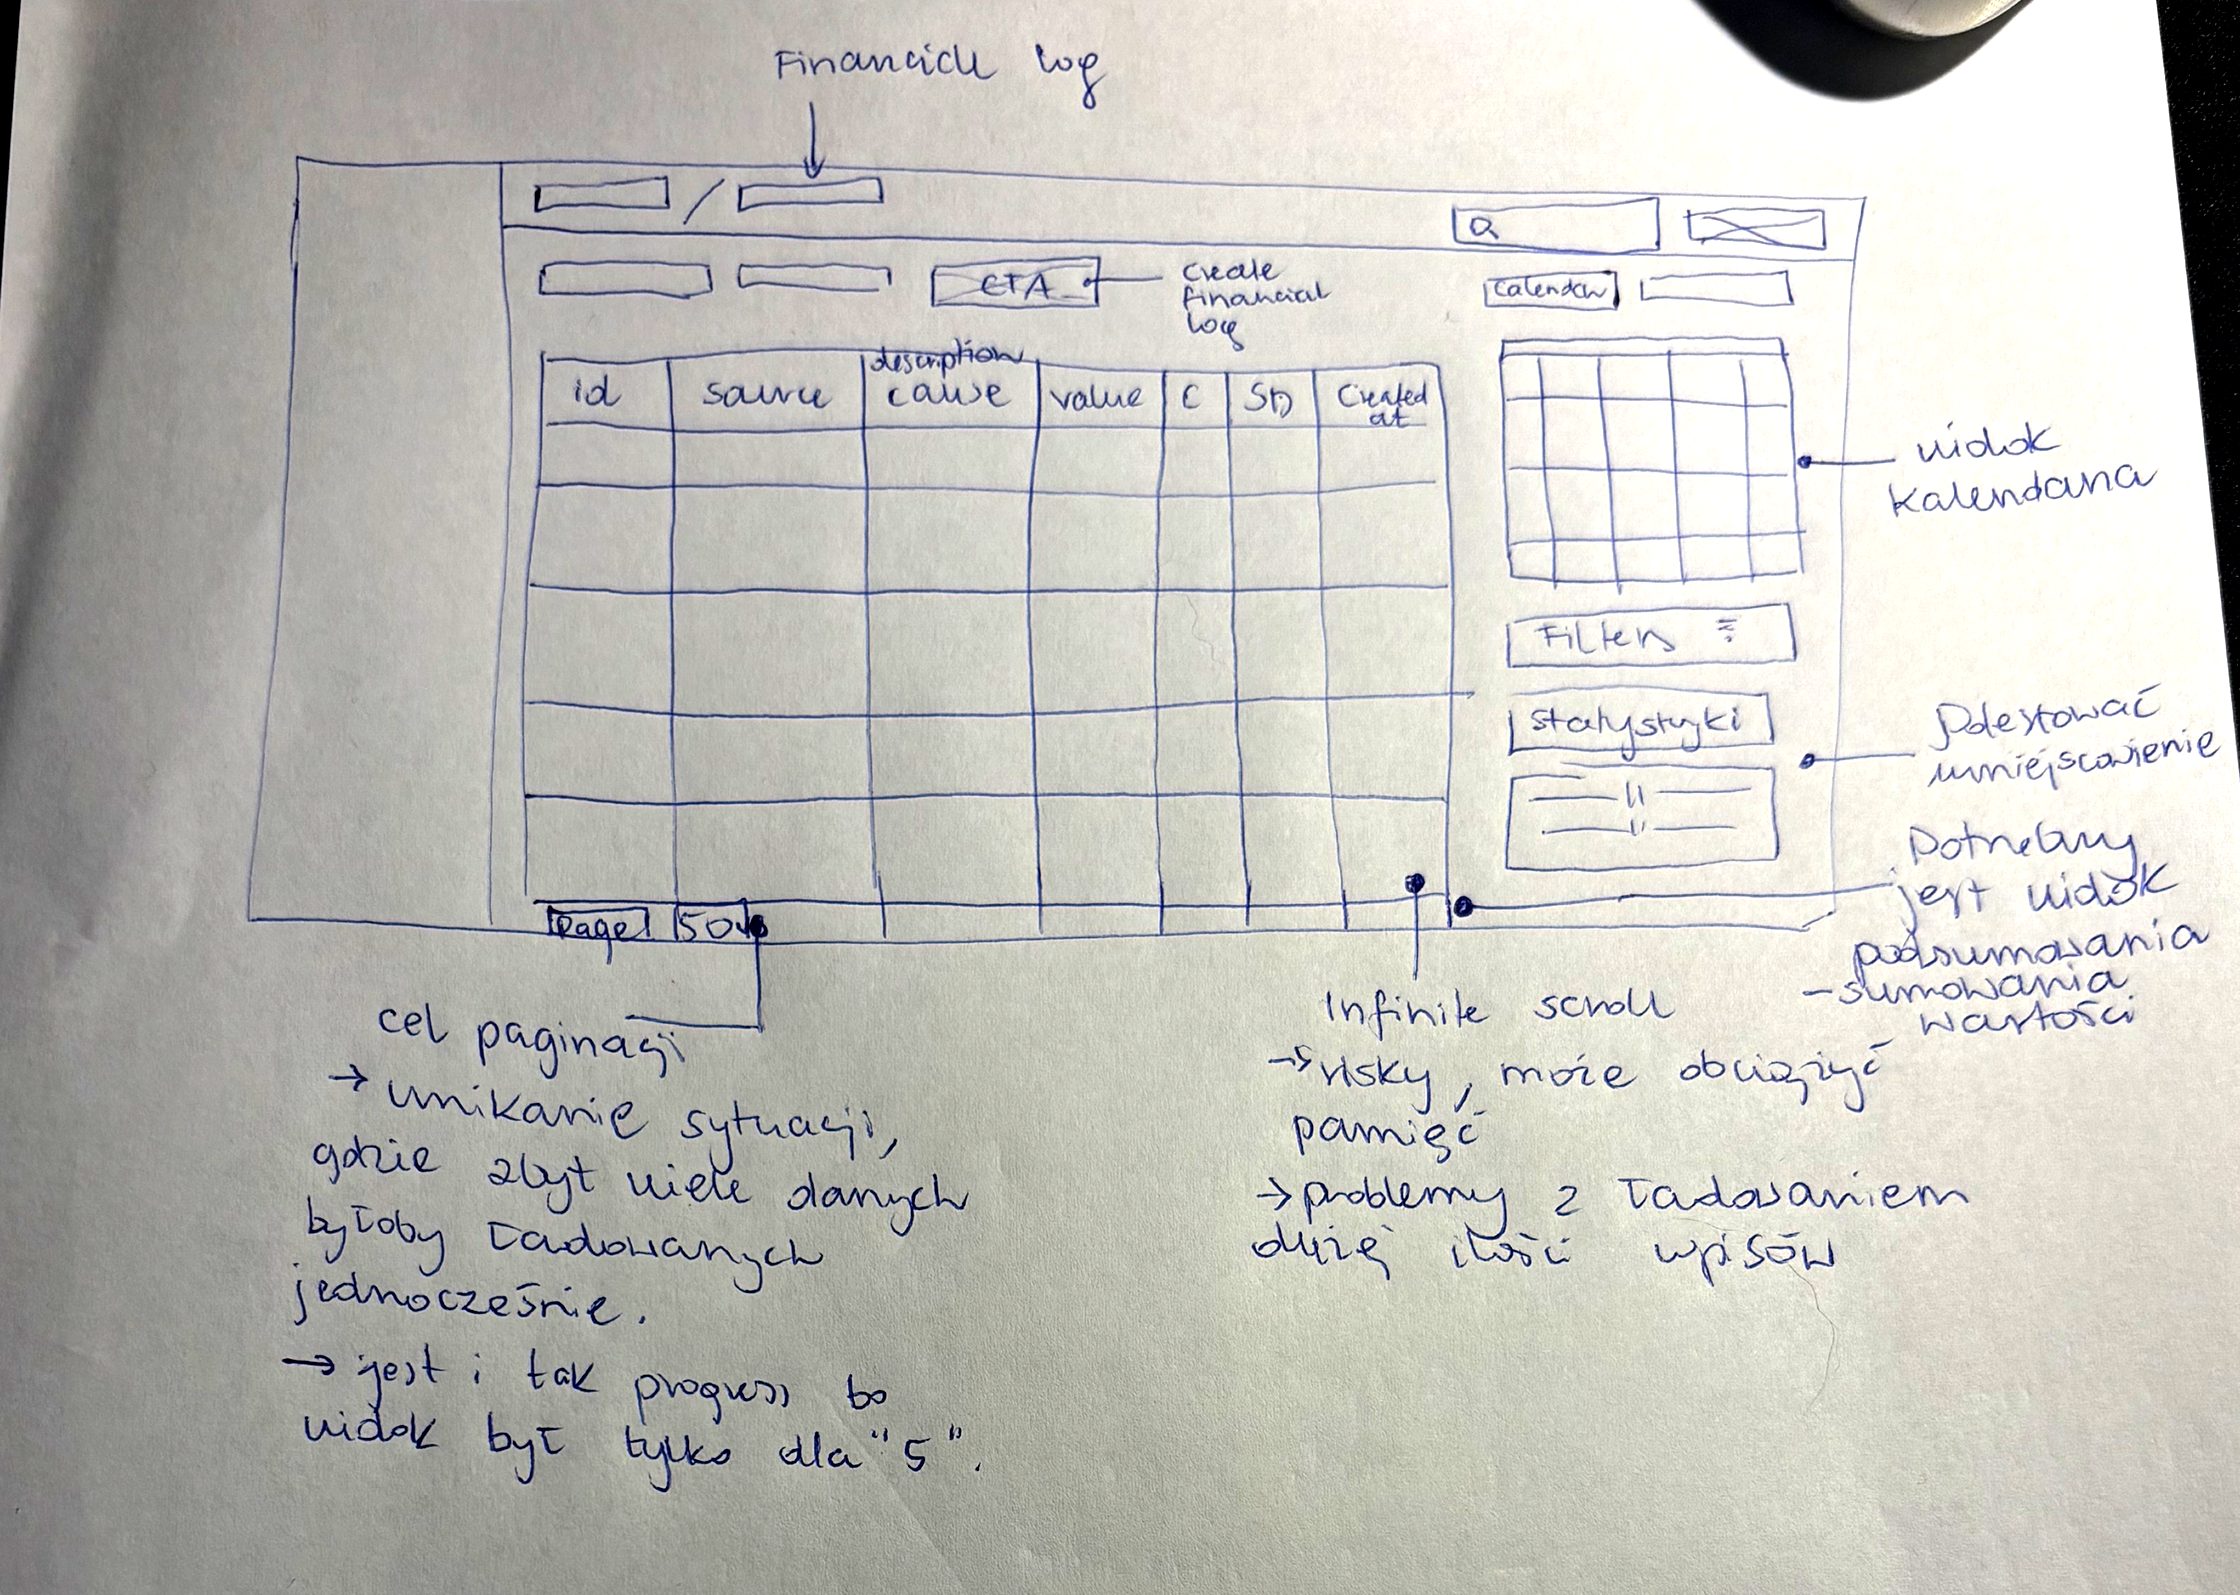
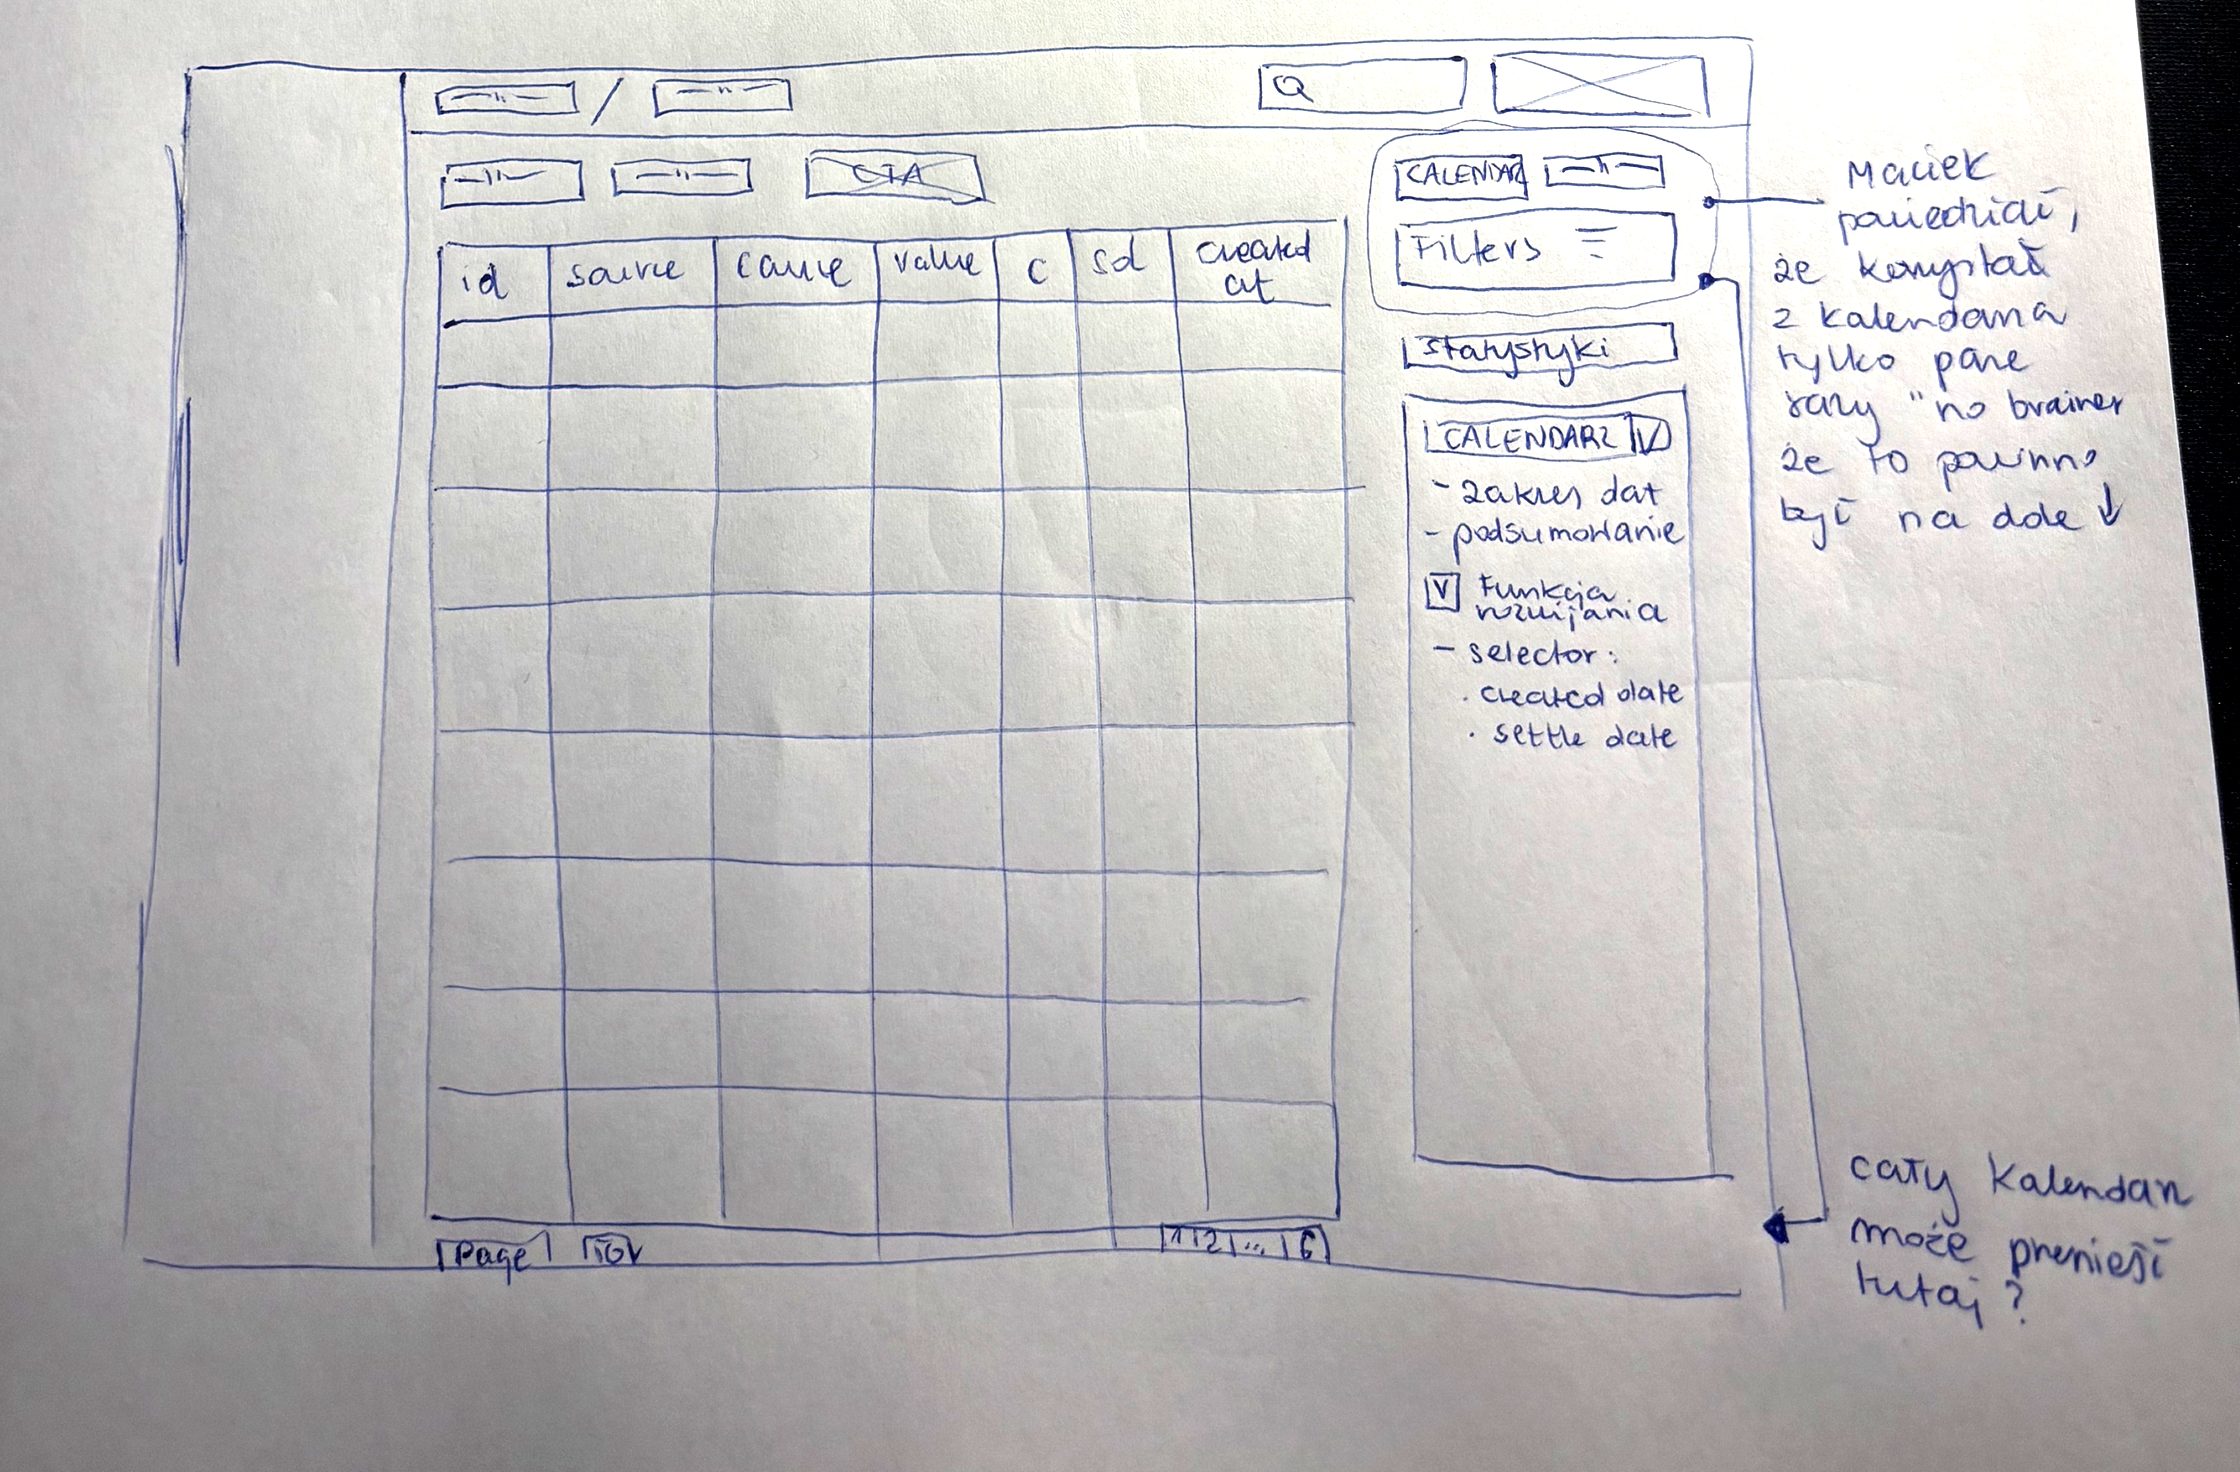
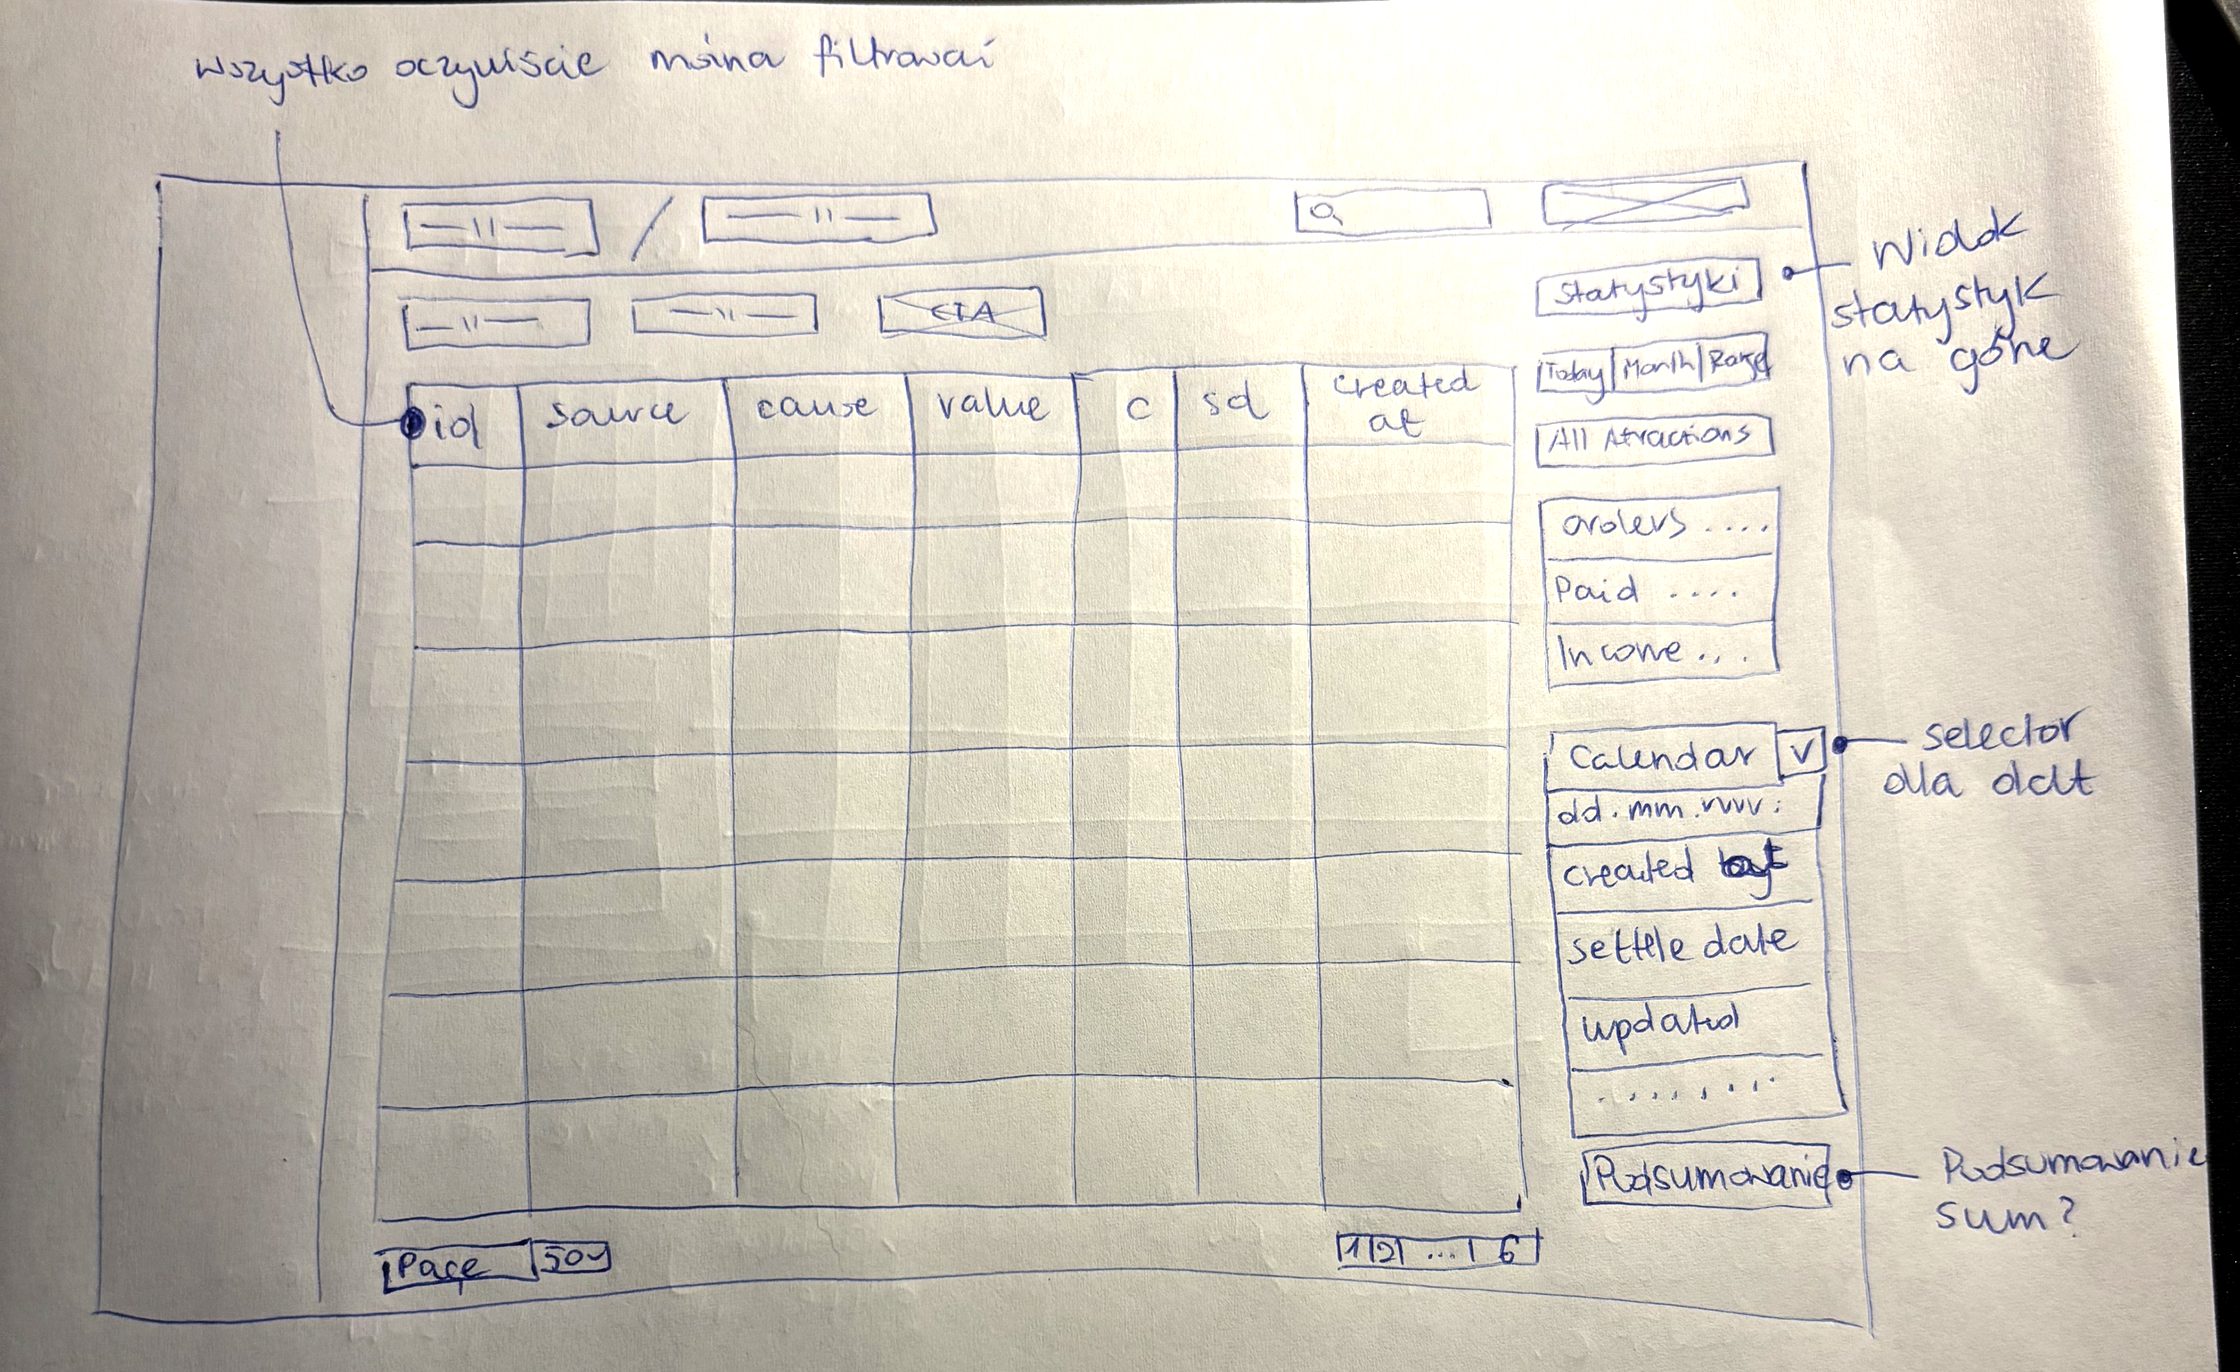
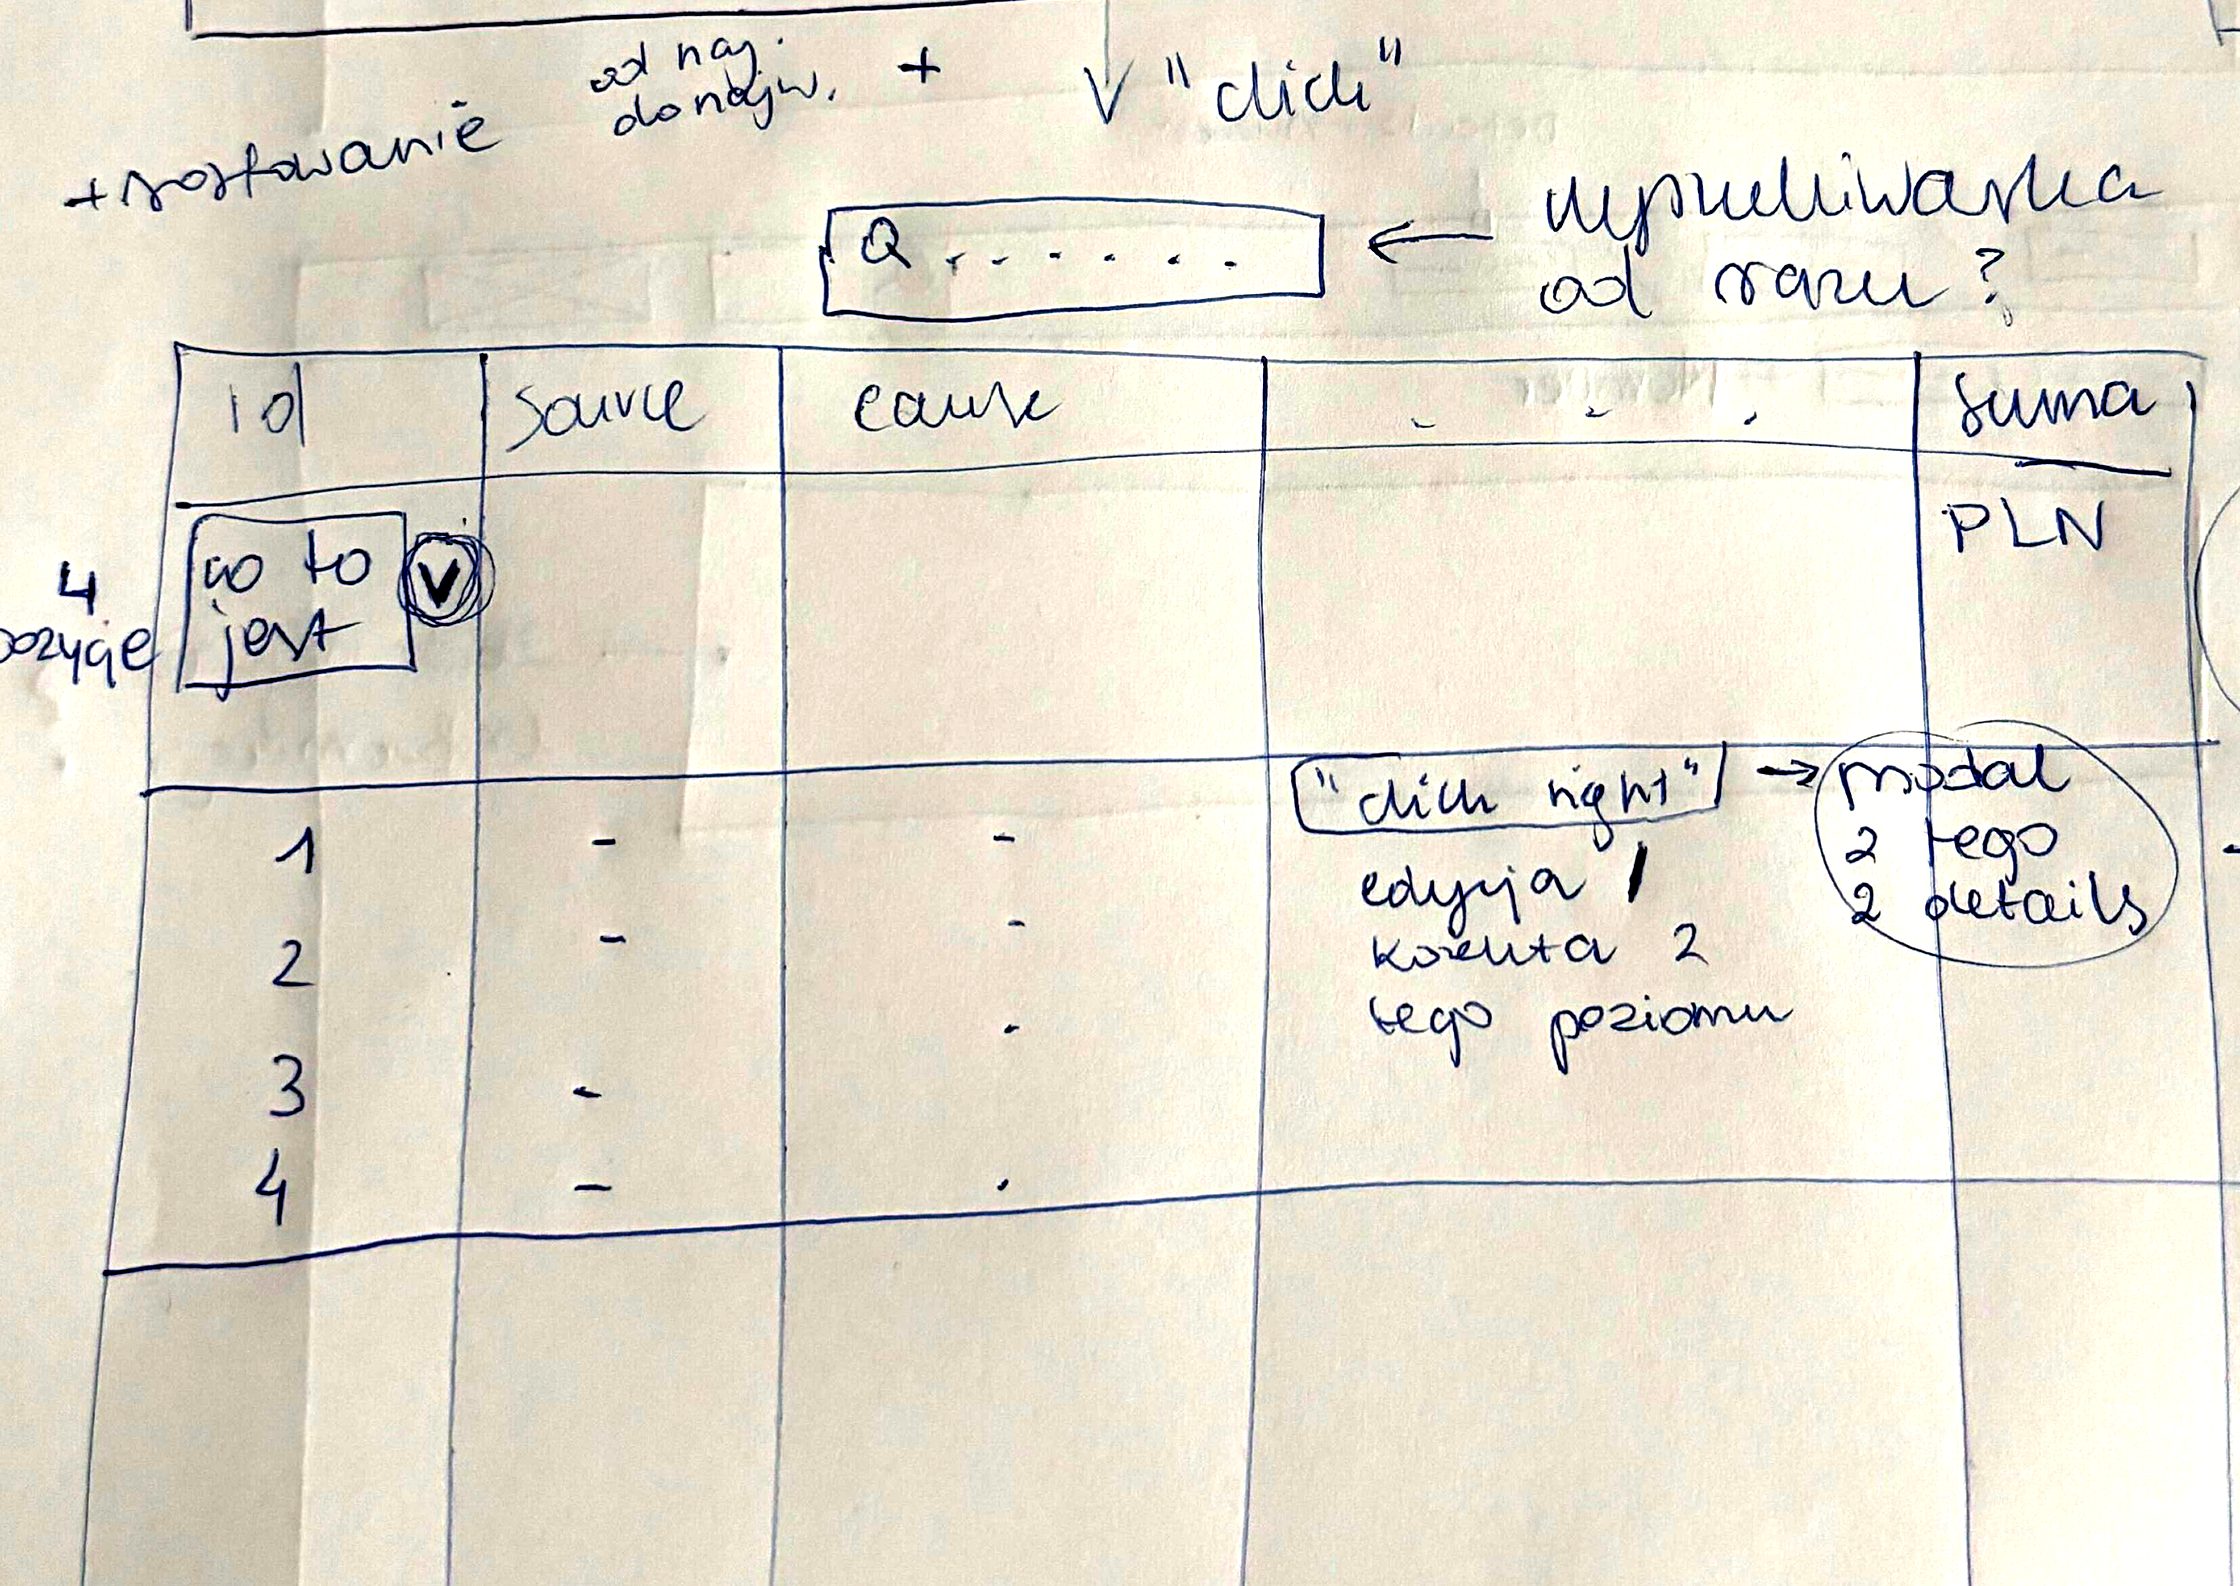
- Pagination, not infinite scroll: with tens of thousands of entries, infinite scroll risks memory and loading problems. Instead of a fixed five rows, people choose how many rows a page shows.
- A user told me he had used the calendar only a few times, so it moved down: from a big panel to a collapsible date filter with a choice of created date or settle date.
- Statistics moved to the top instead: today, this month or a custom range, with orders, payments and income at a glance.
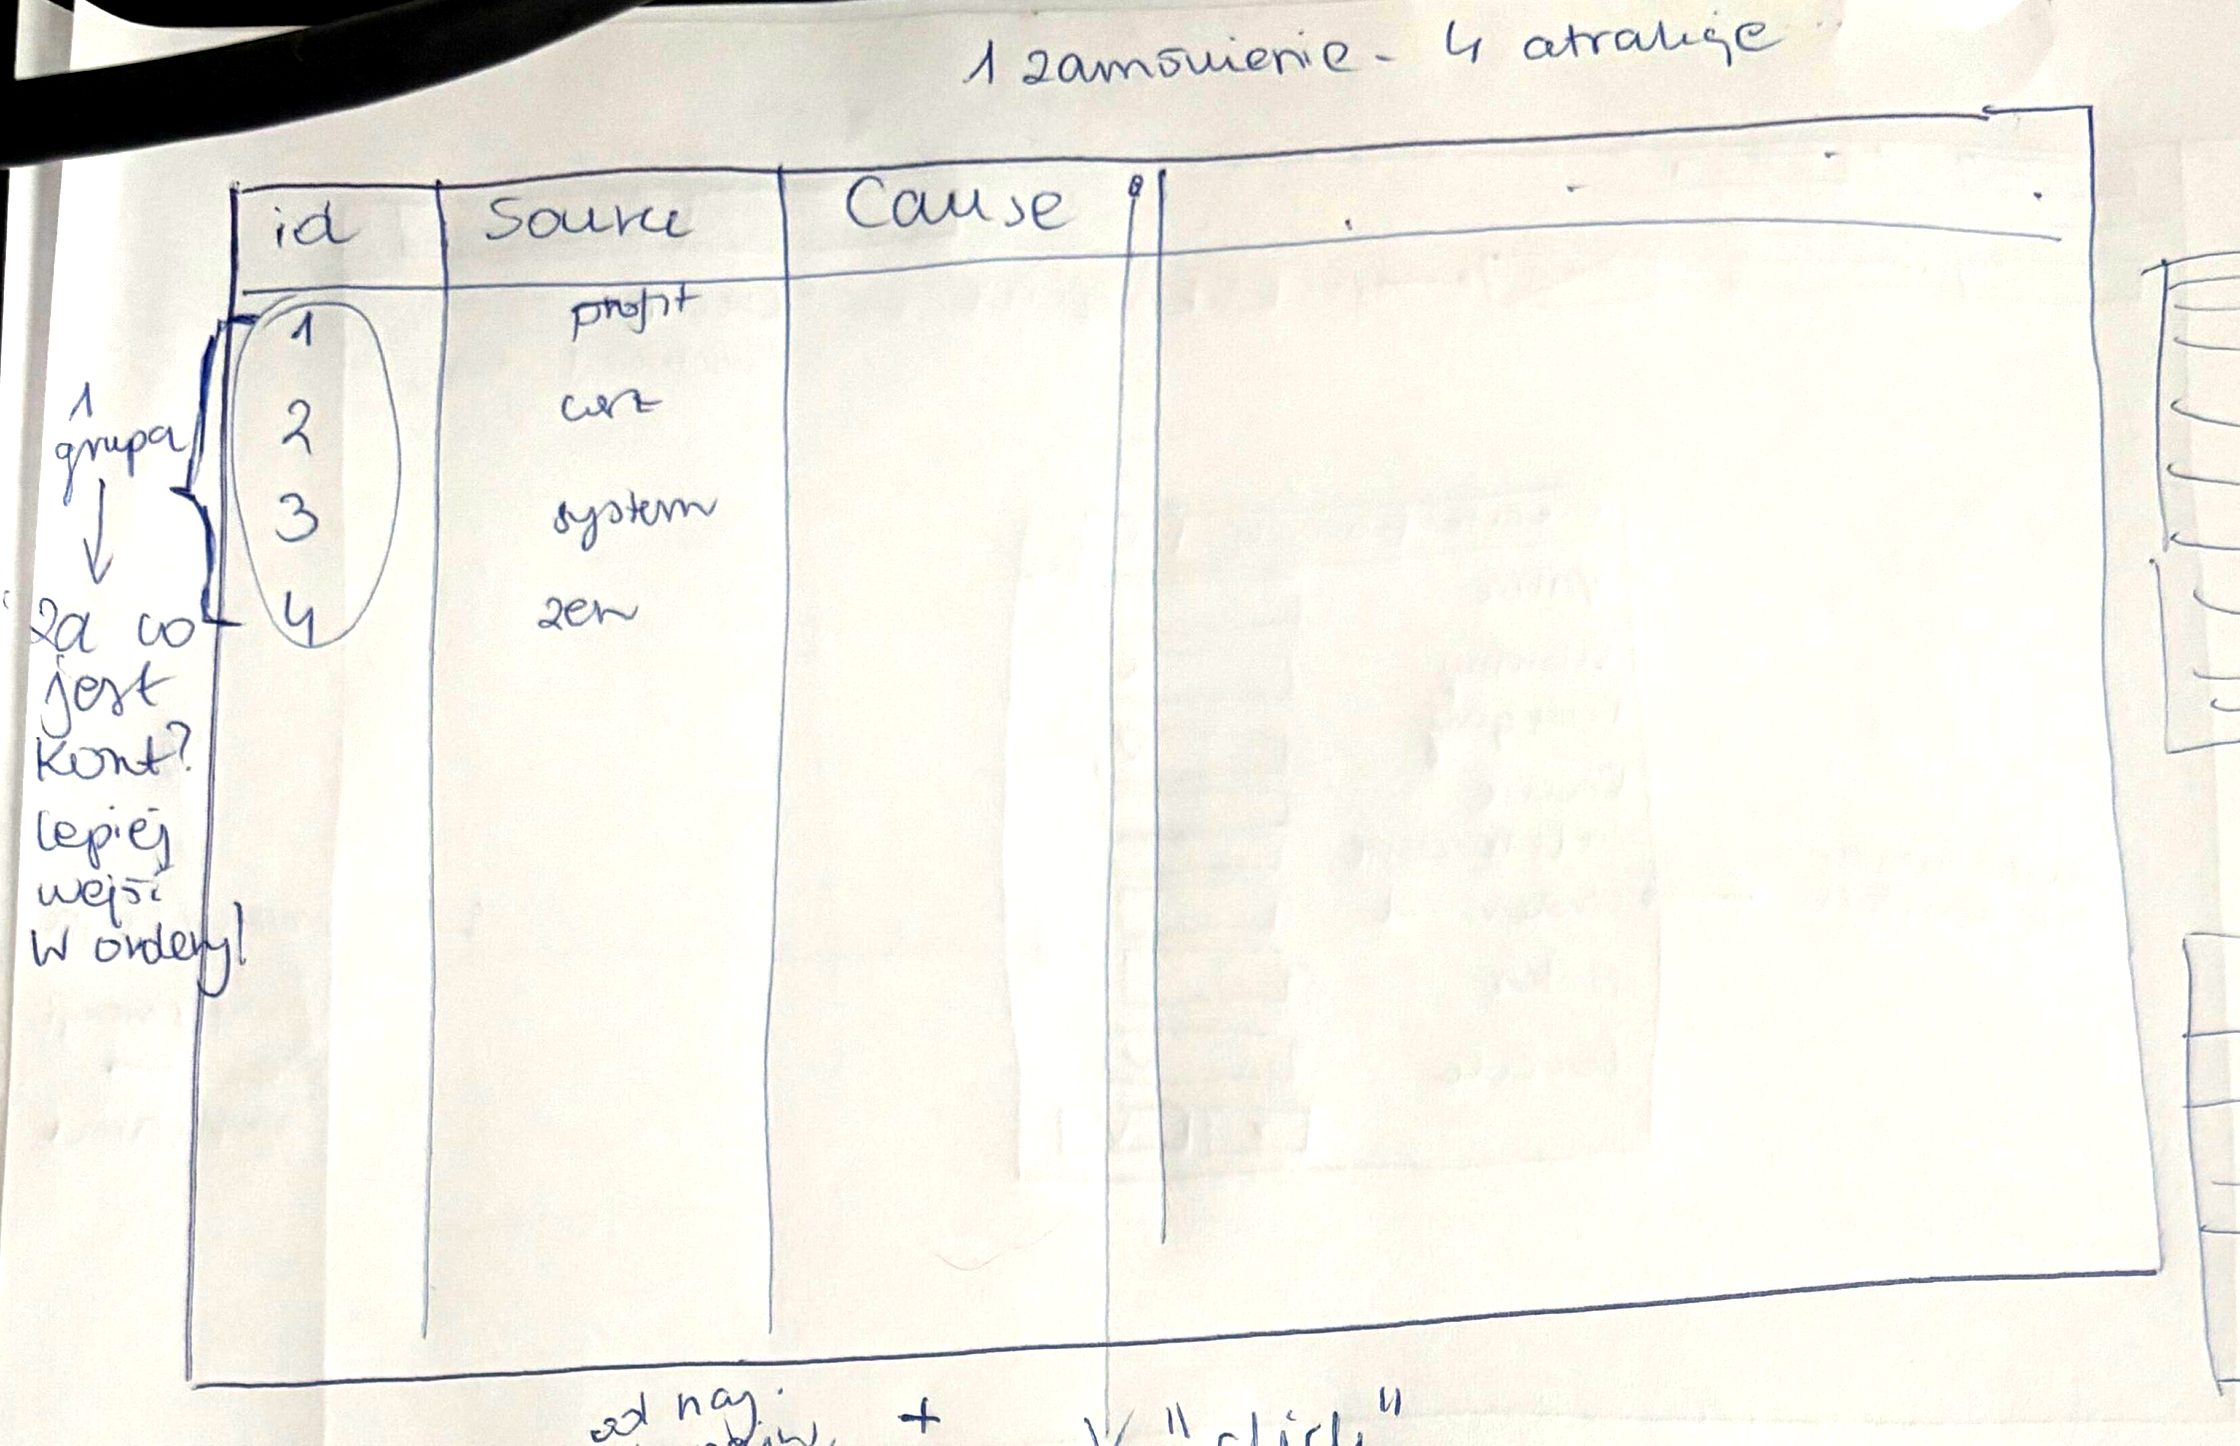
- One order can hold four attractions and several entries, such as profit, system and the ZEN fee. I grouped the entries of one order into one expandable row with a sum in PLN, sorted from newest to oldest.
- A right click on a row opens editing or a correction at that level, and the details open in a modal.
06 · Financial Log: the screens
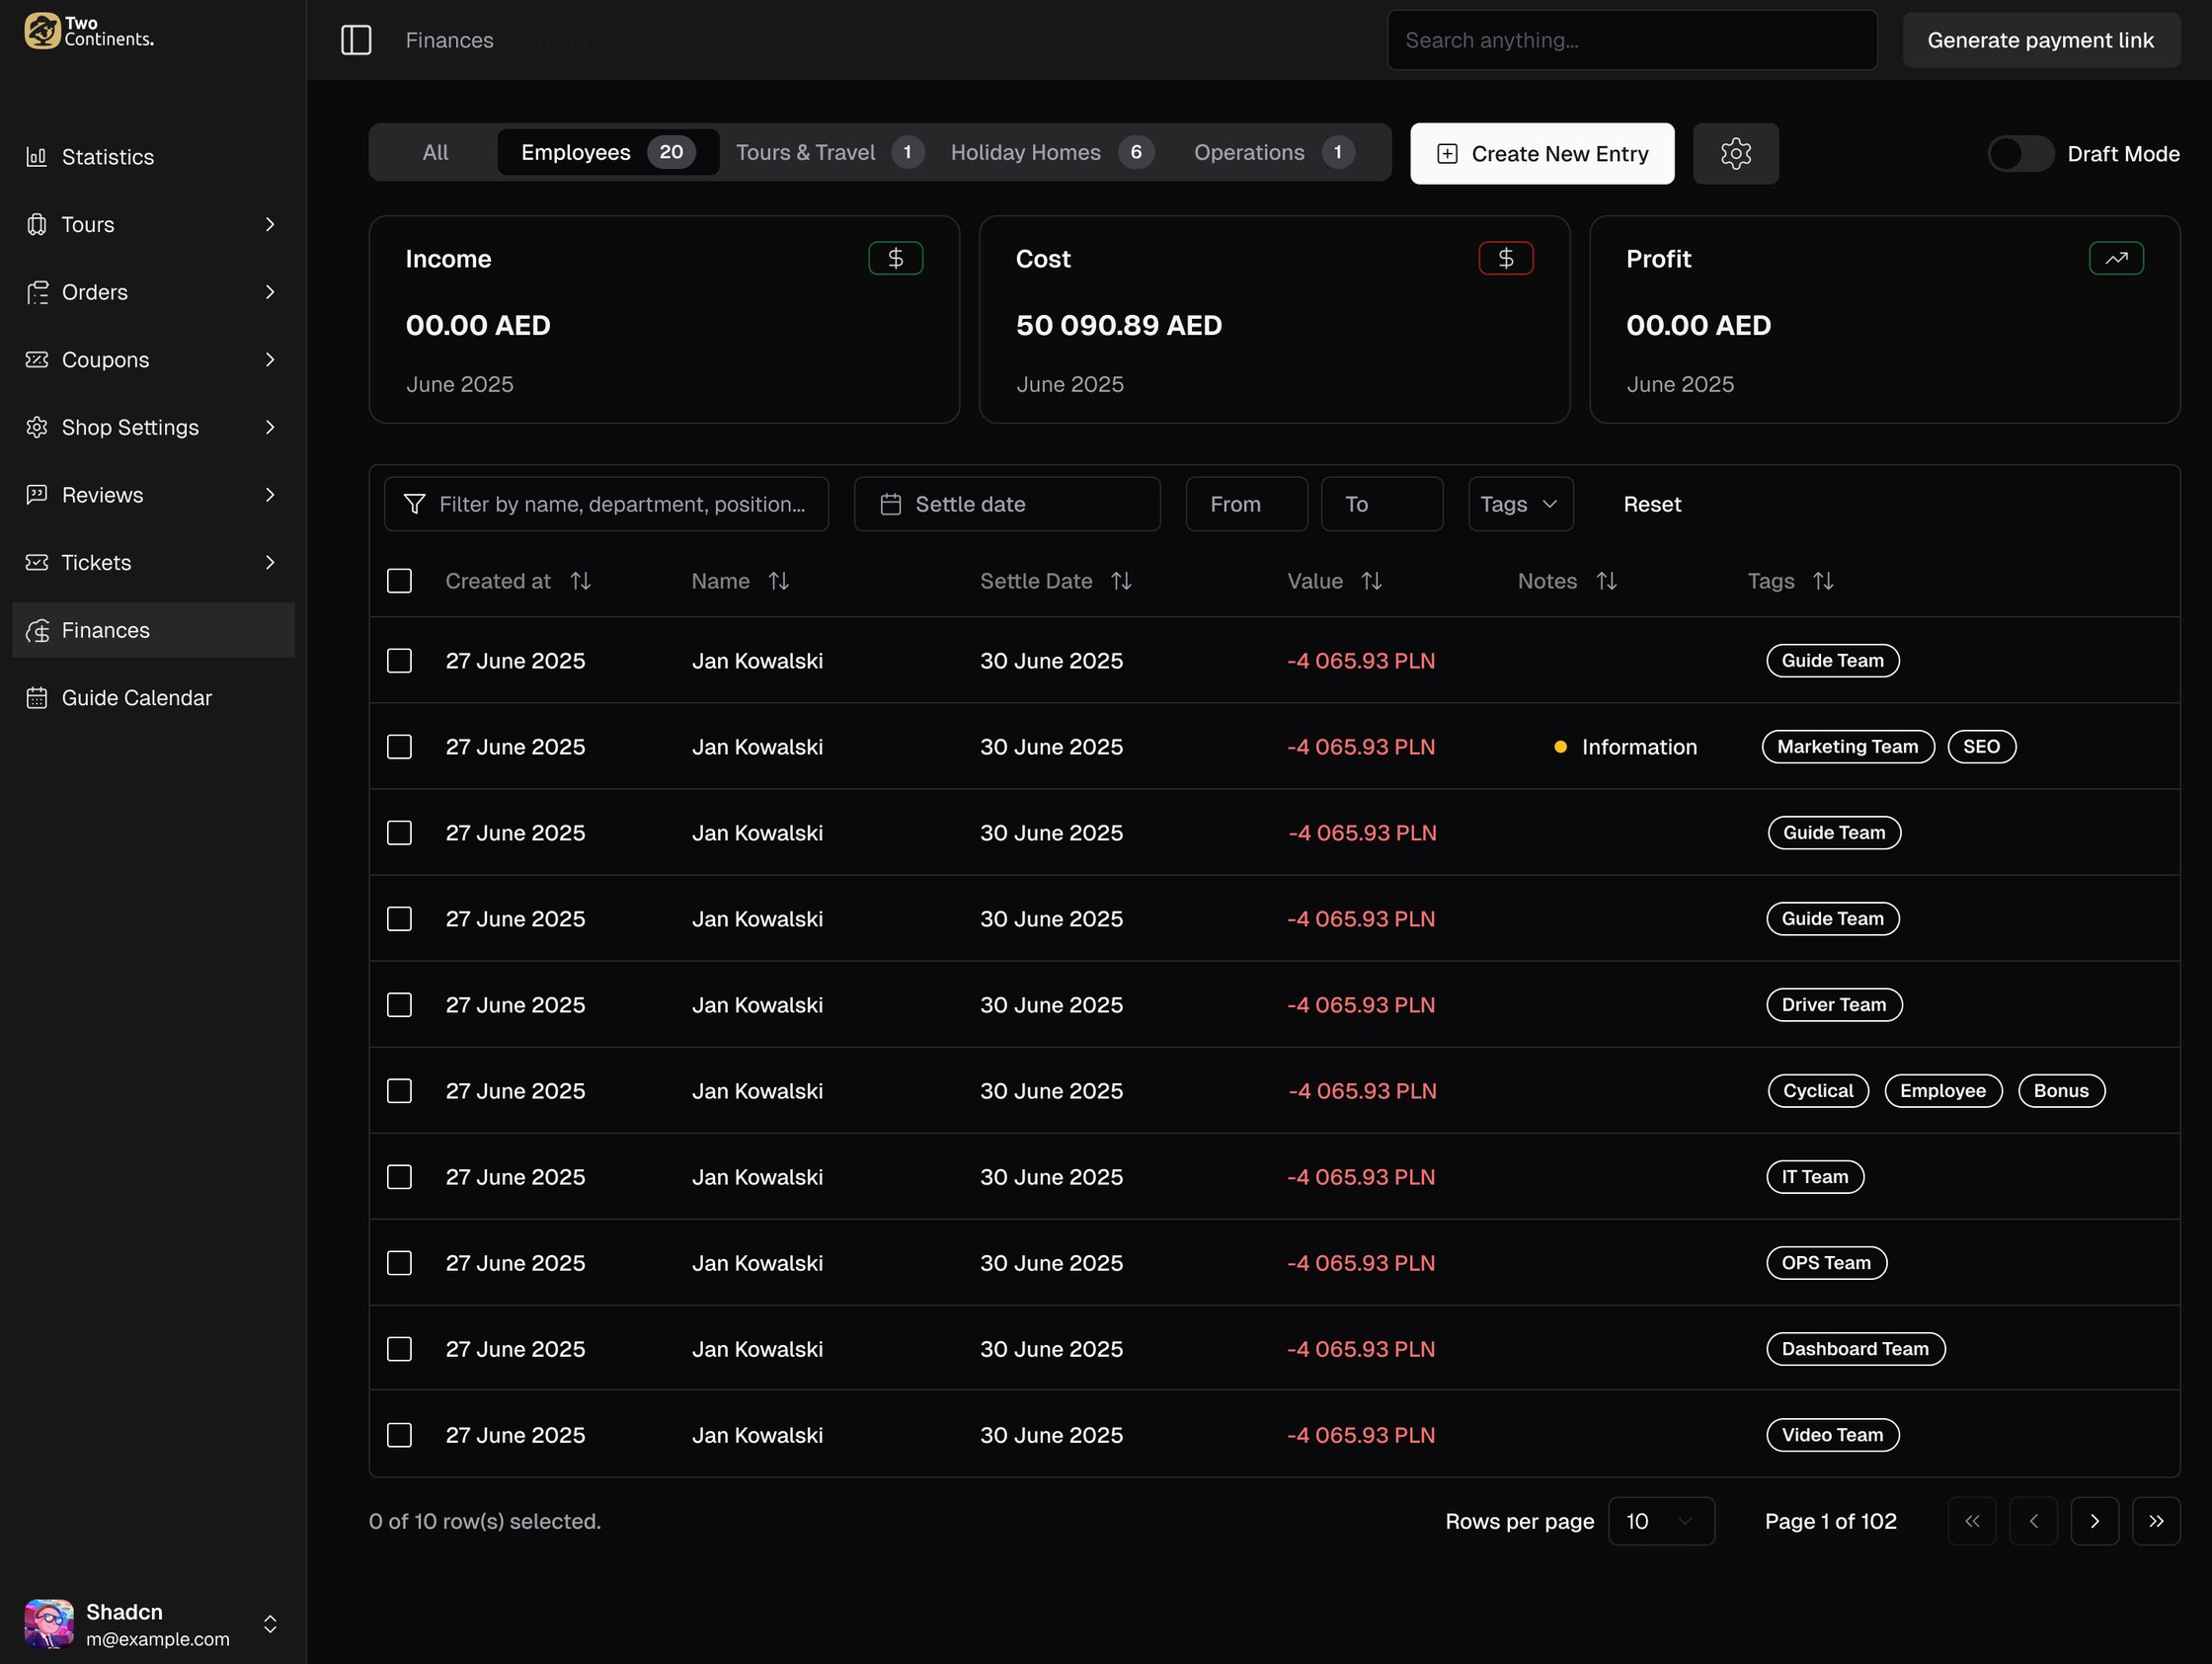
One log for the whole company, a view for each category, and the numbers people need on top.
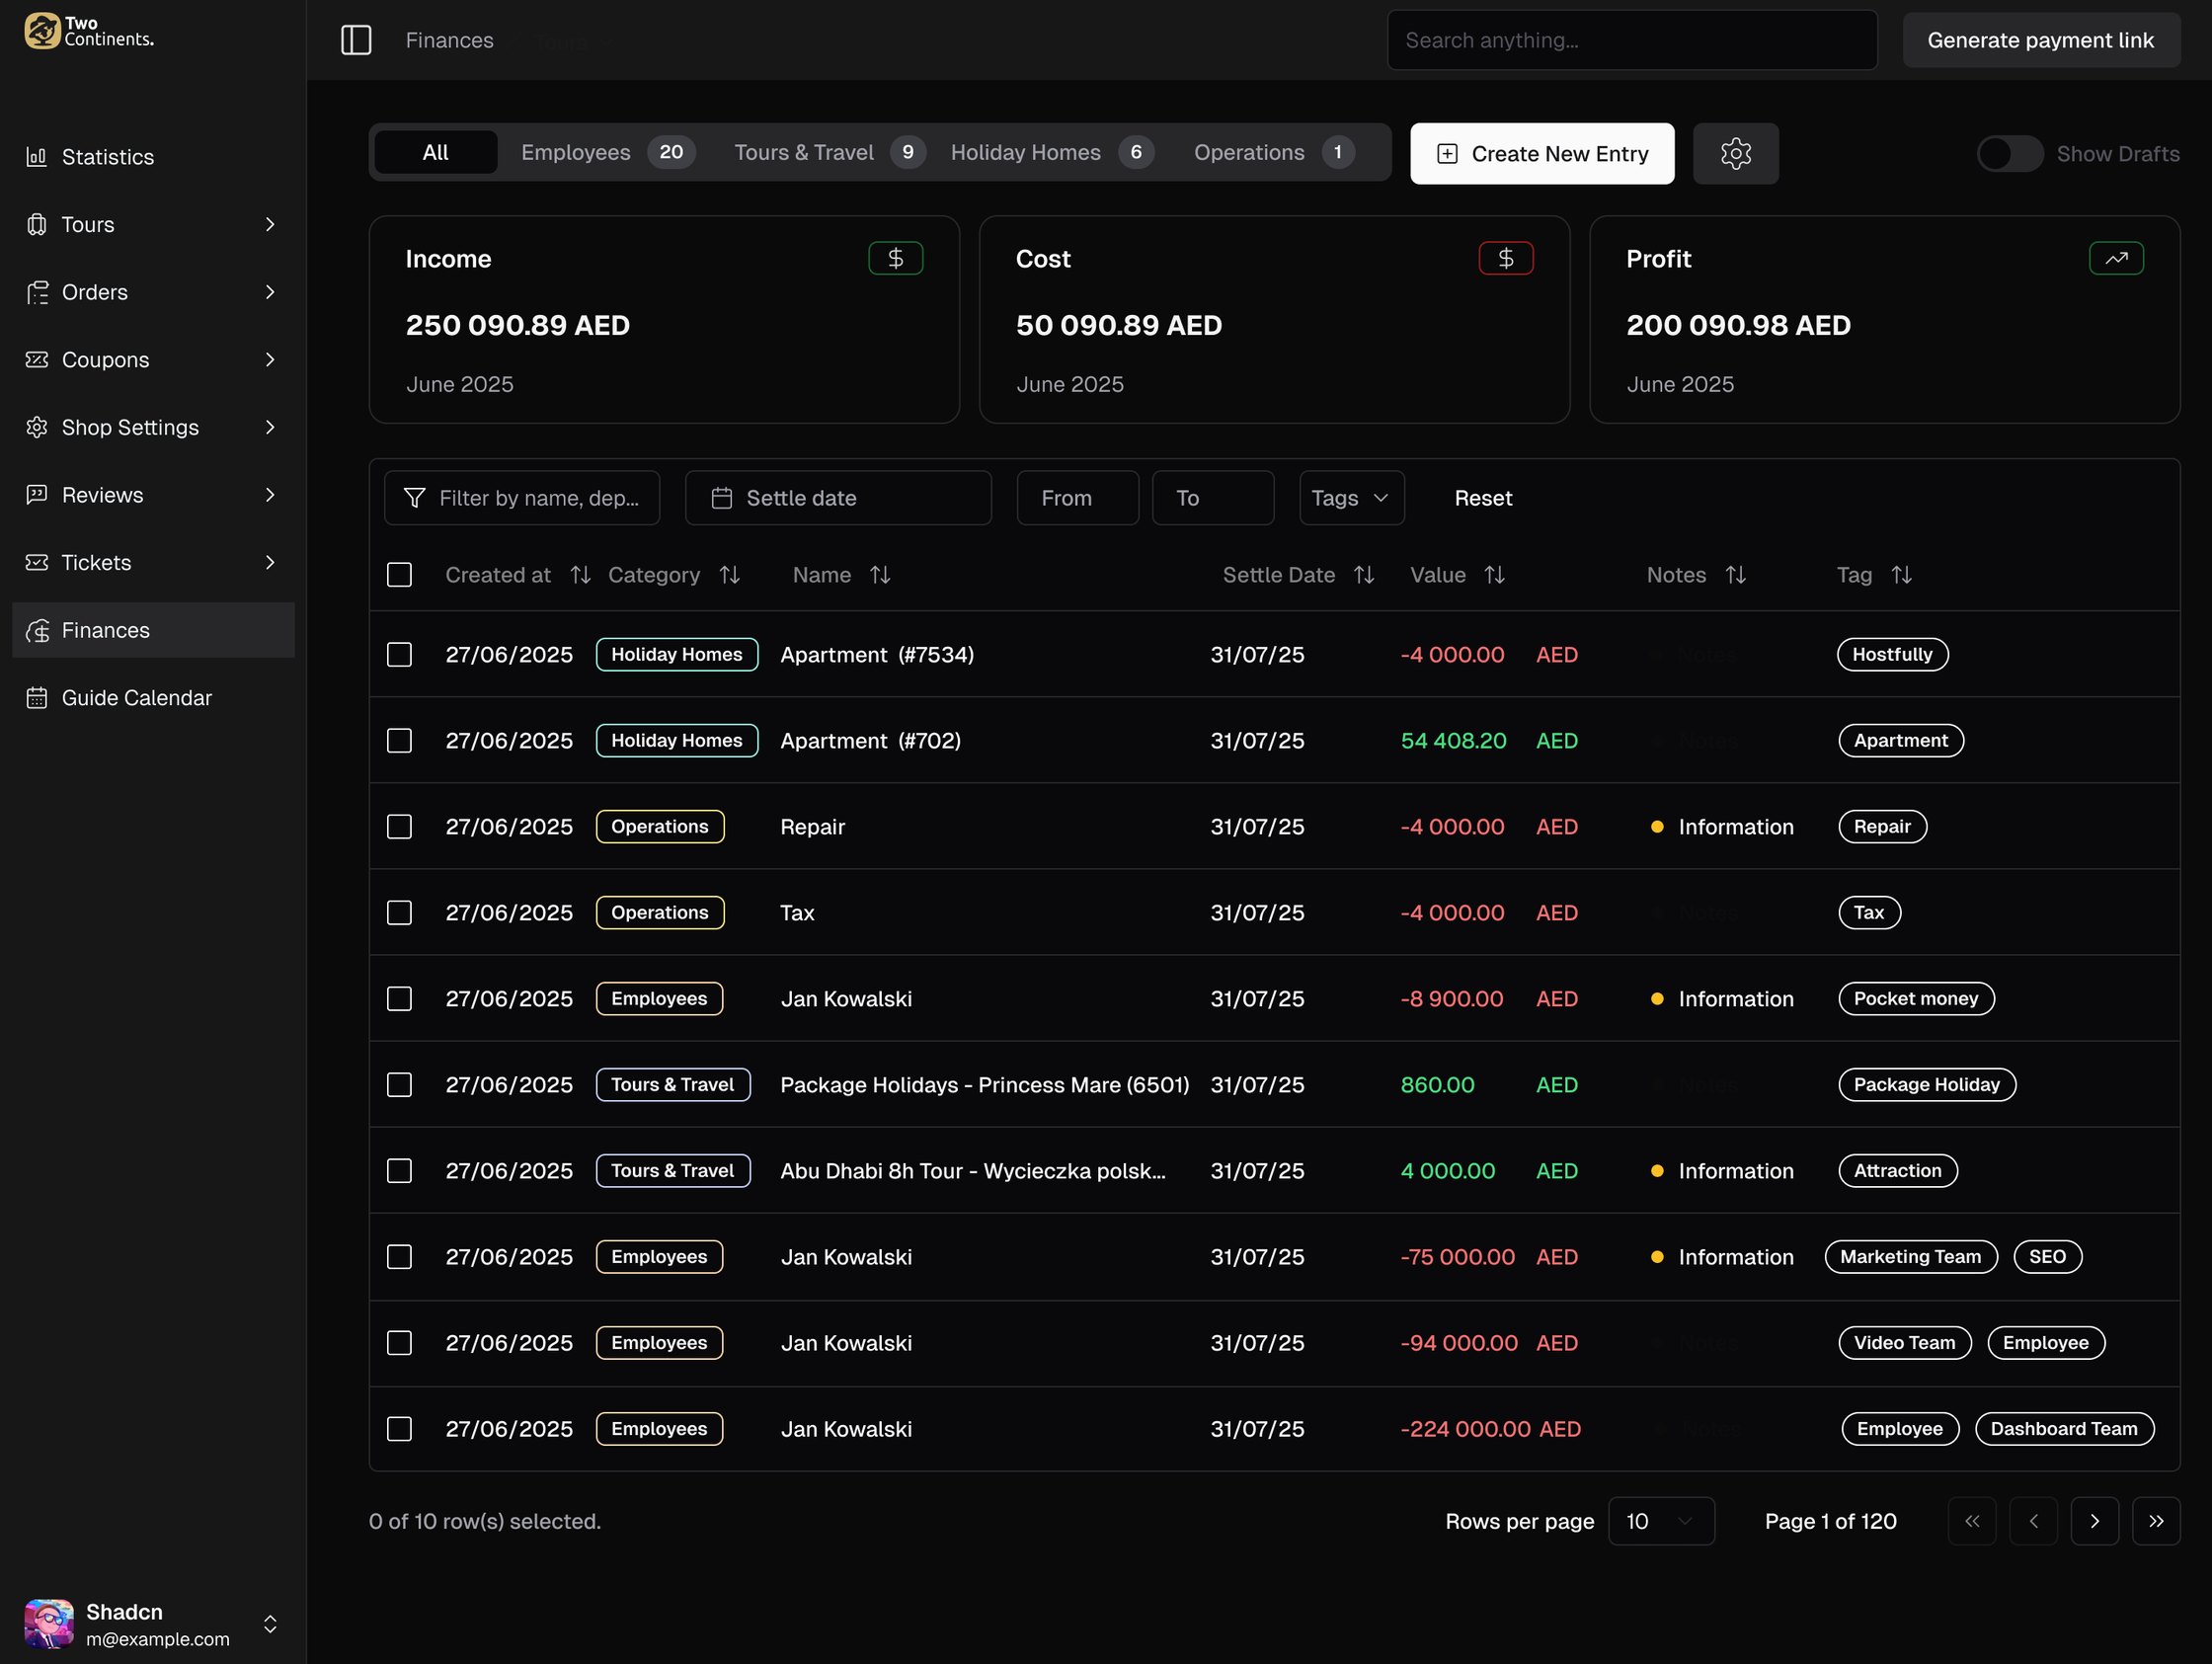
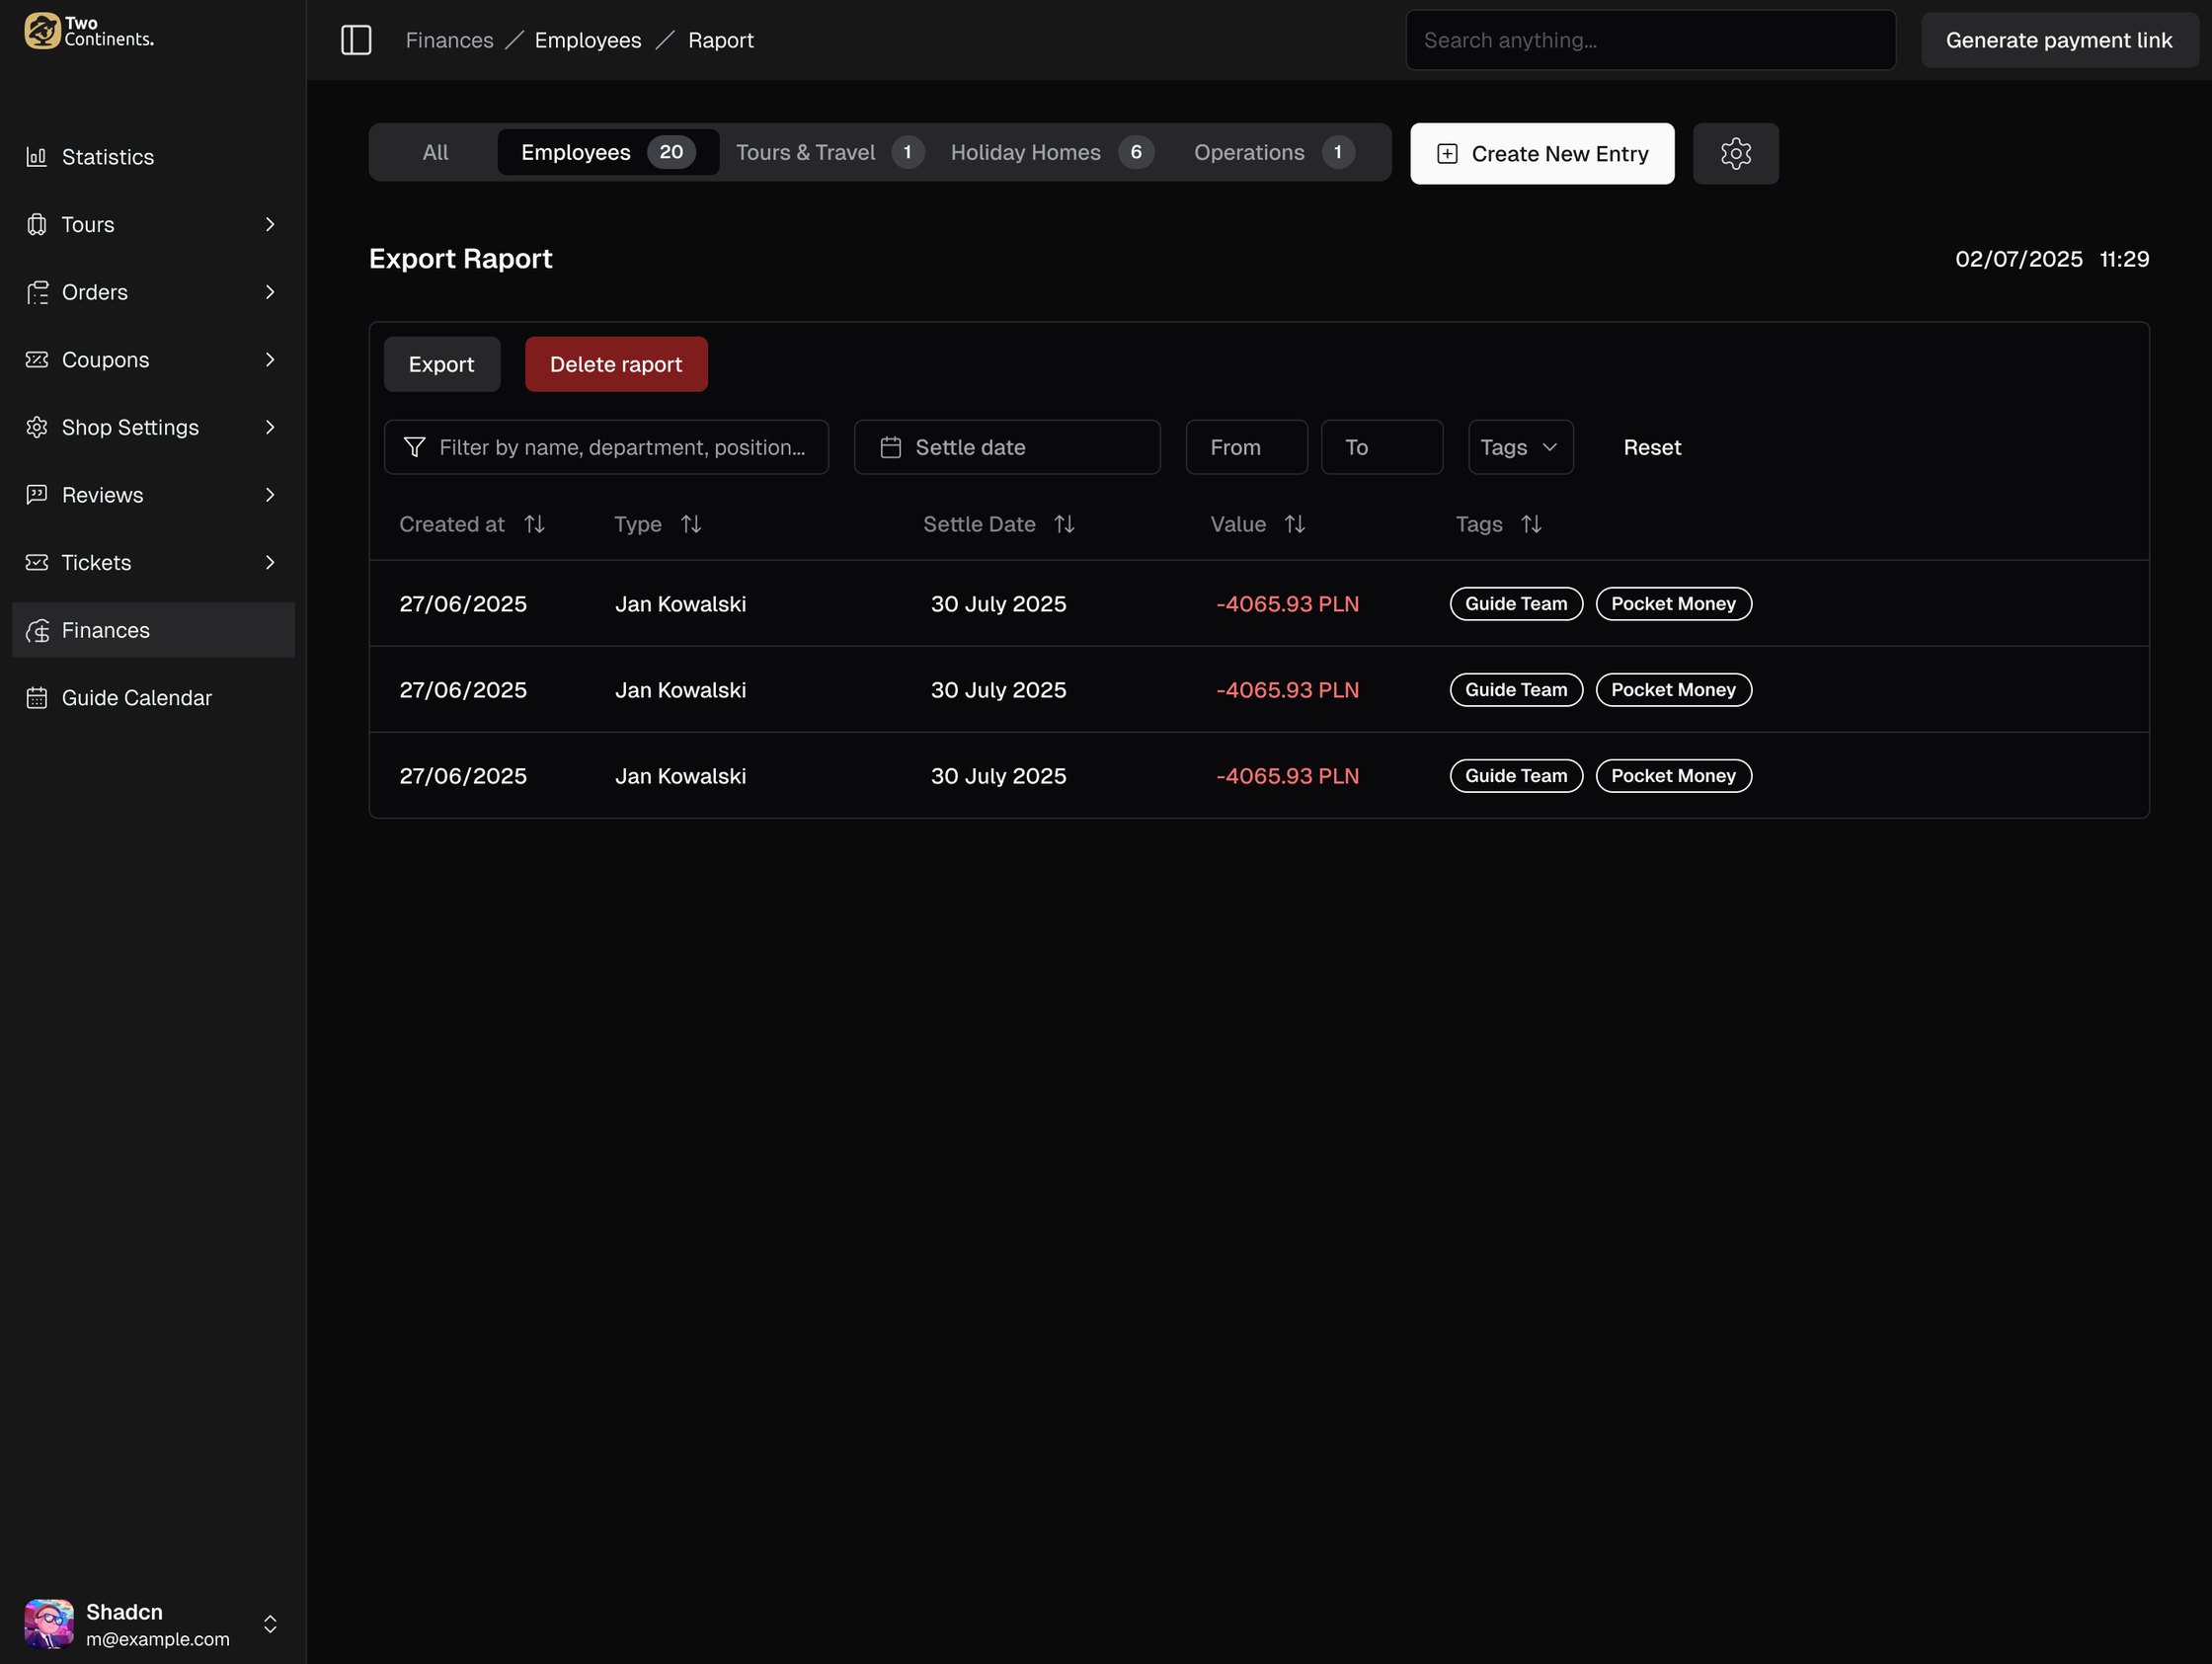
- Tabs for All, Employees, Tours & Travel, Holiday Homes and Operations, each with income, cost and profit for the period at the top.
- A search box, a settle date, a value range and tags instead of twelve filter fields, and every column can be sorted.
- Tags carry the detail: Airbnb or Booking for a stay, Guide Team or Driver Team for a payout, tax, fuel or repair for operations. They are all managed in one settings view.
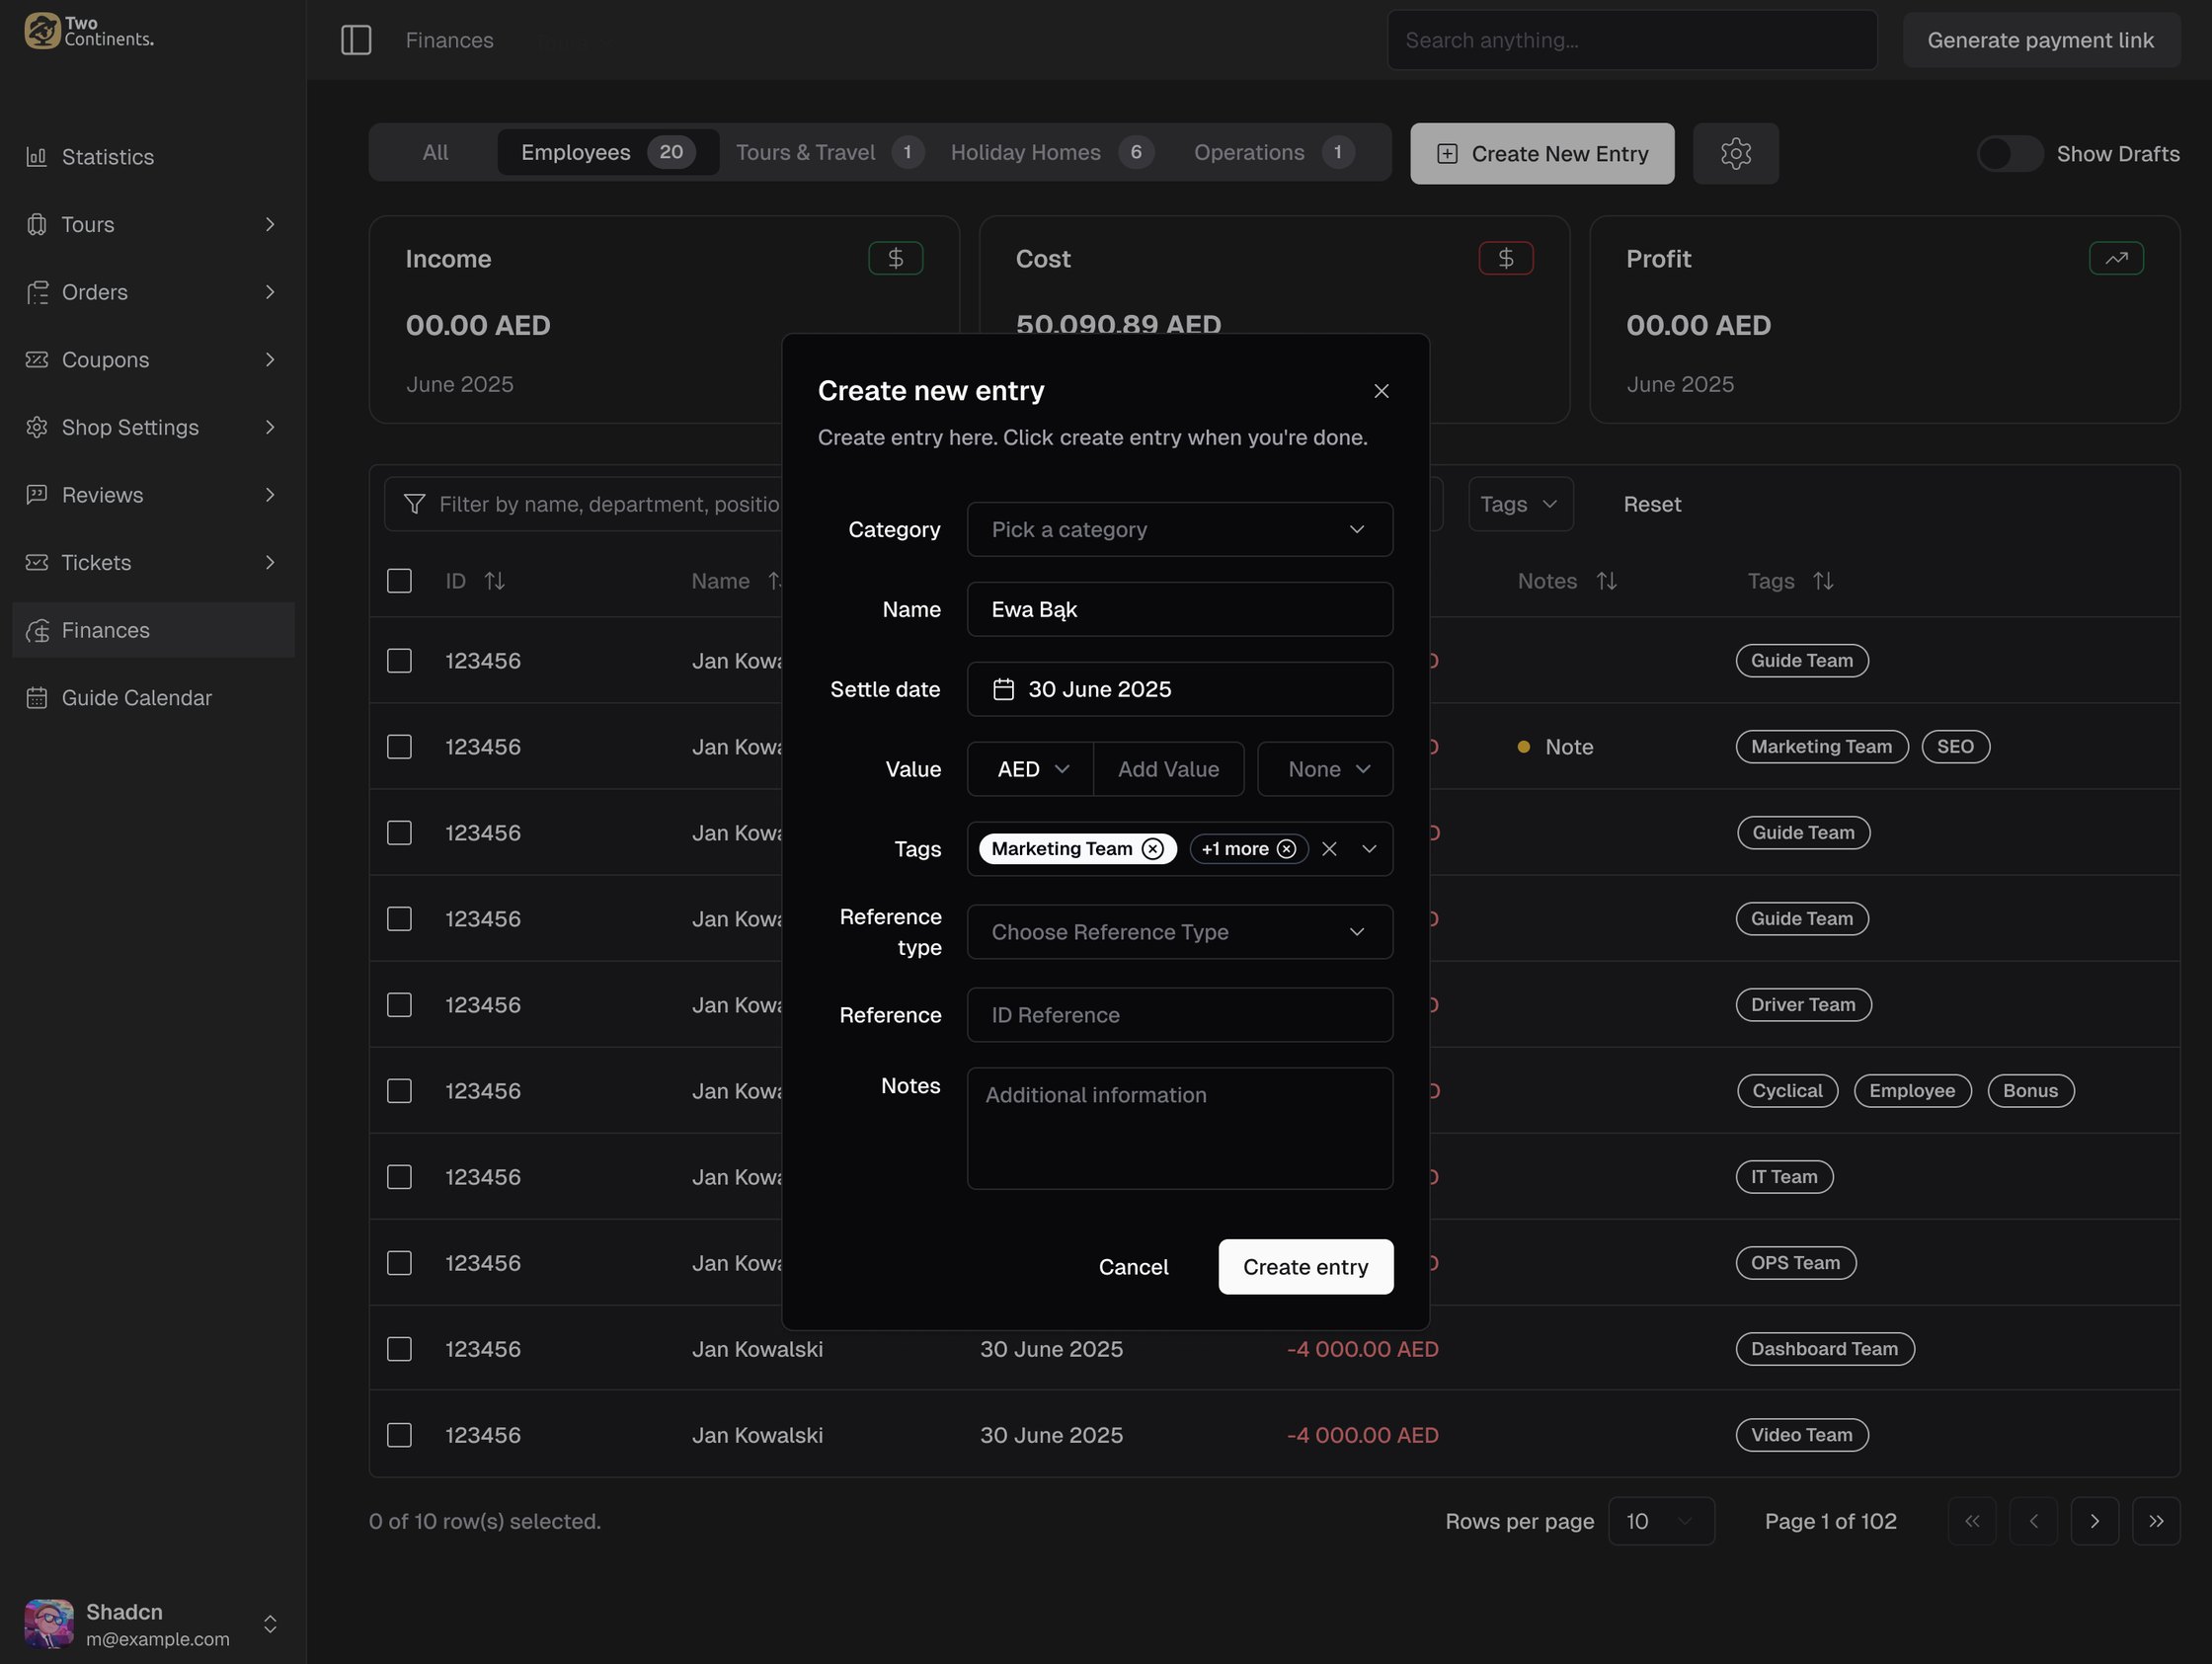
- Adding an entry is one dialog: category, name, settle date, value and currency, tags, a reference and notes.
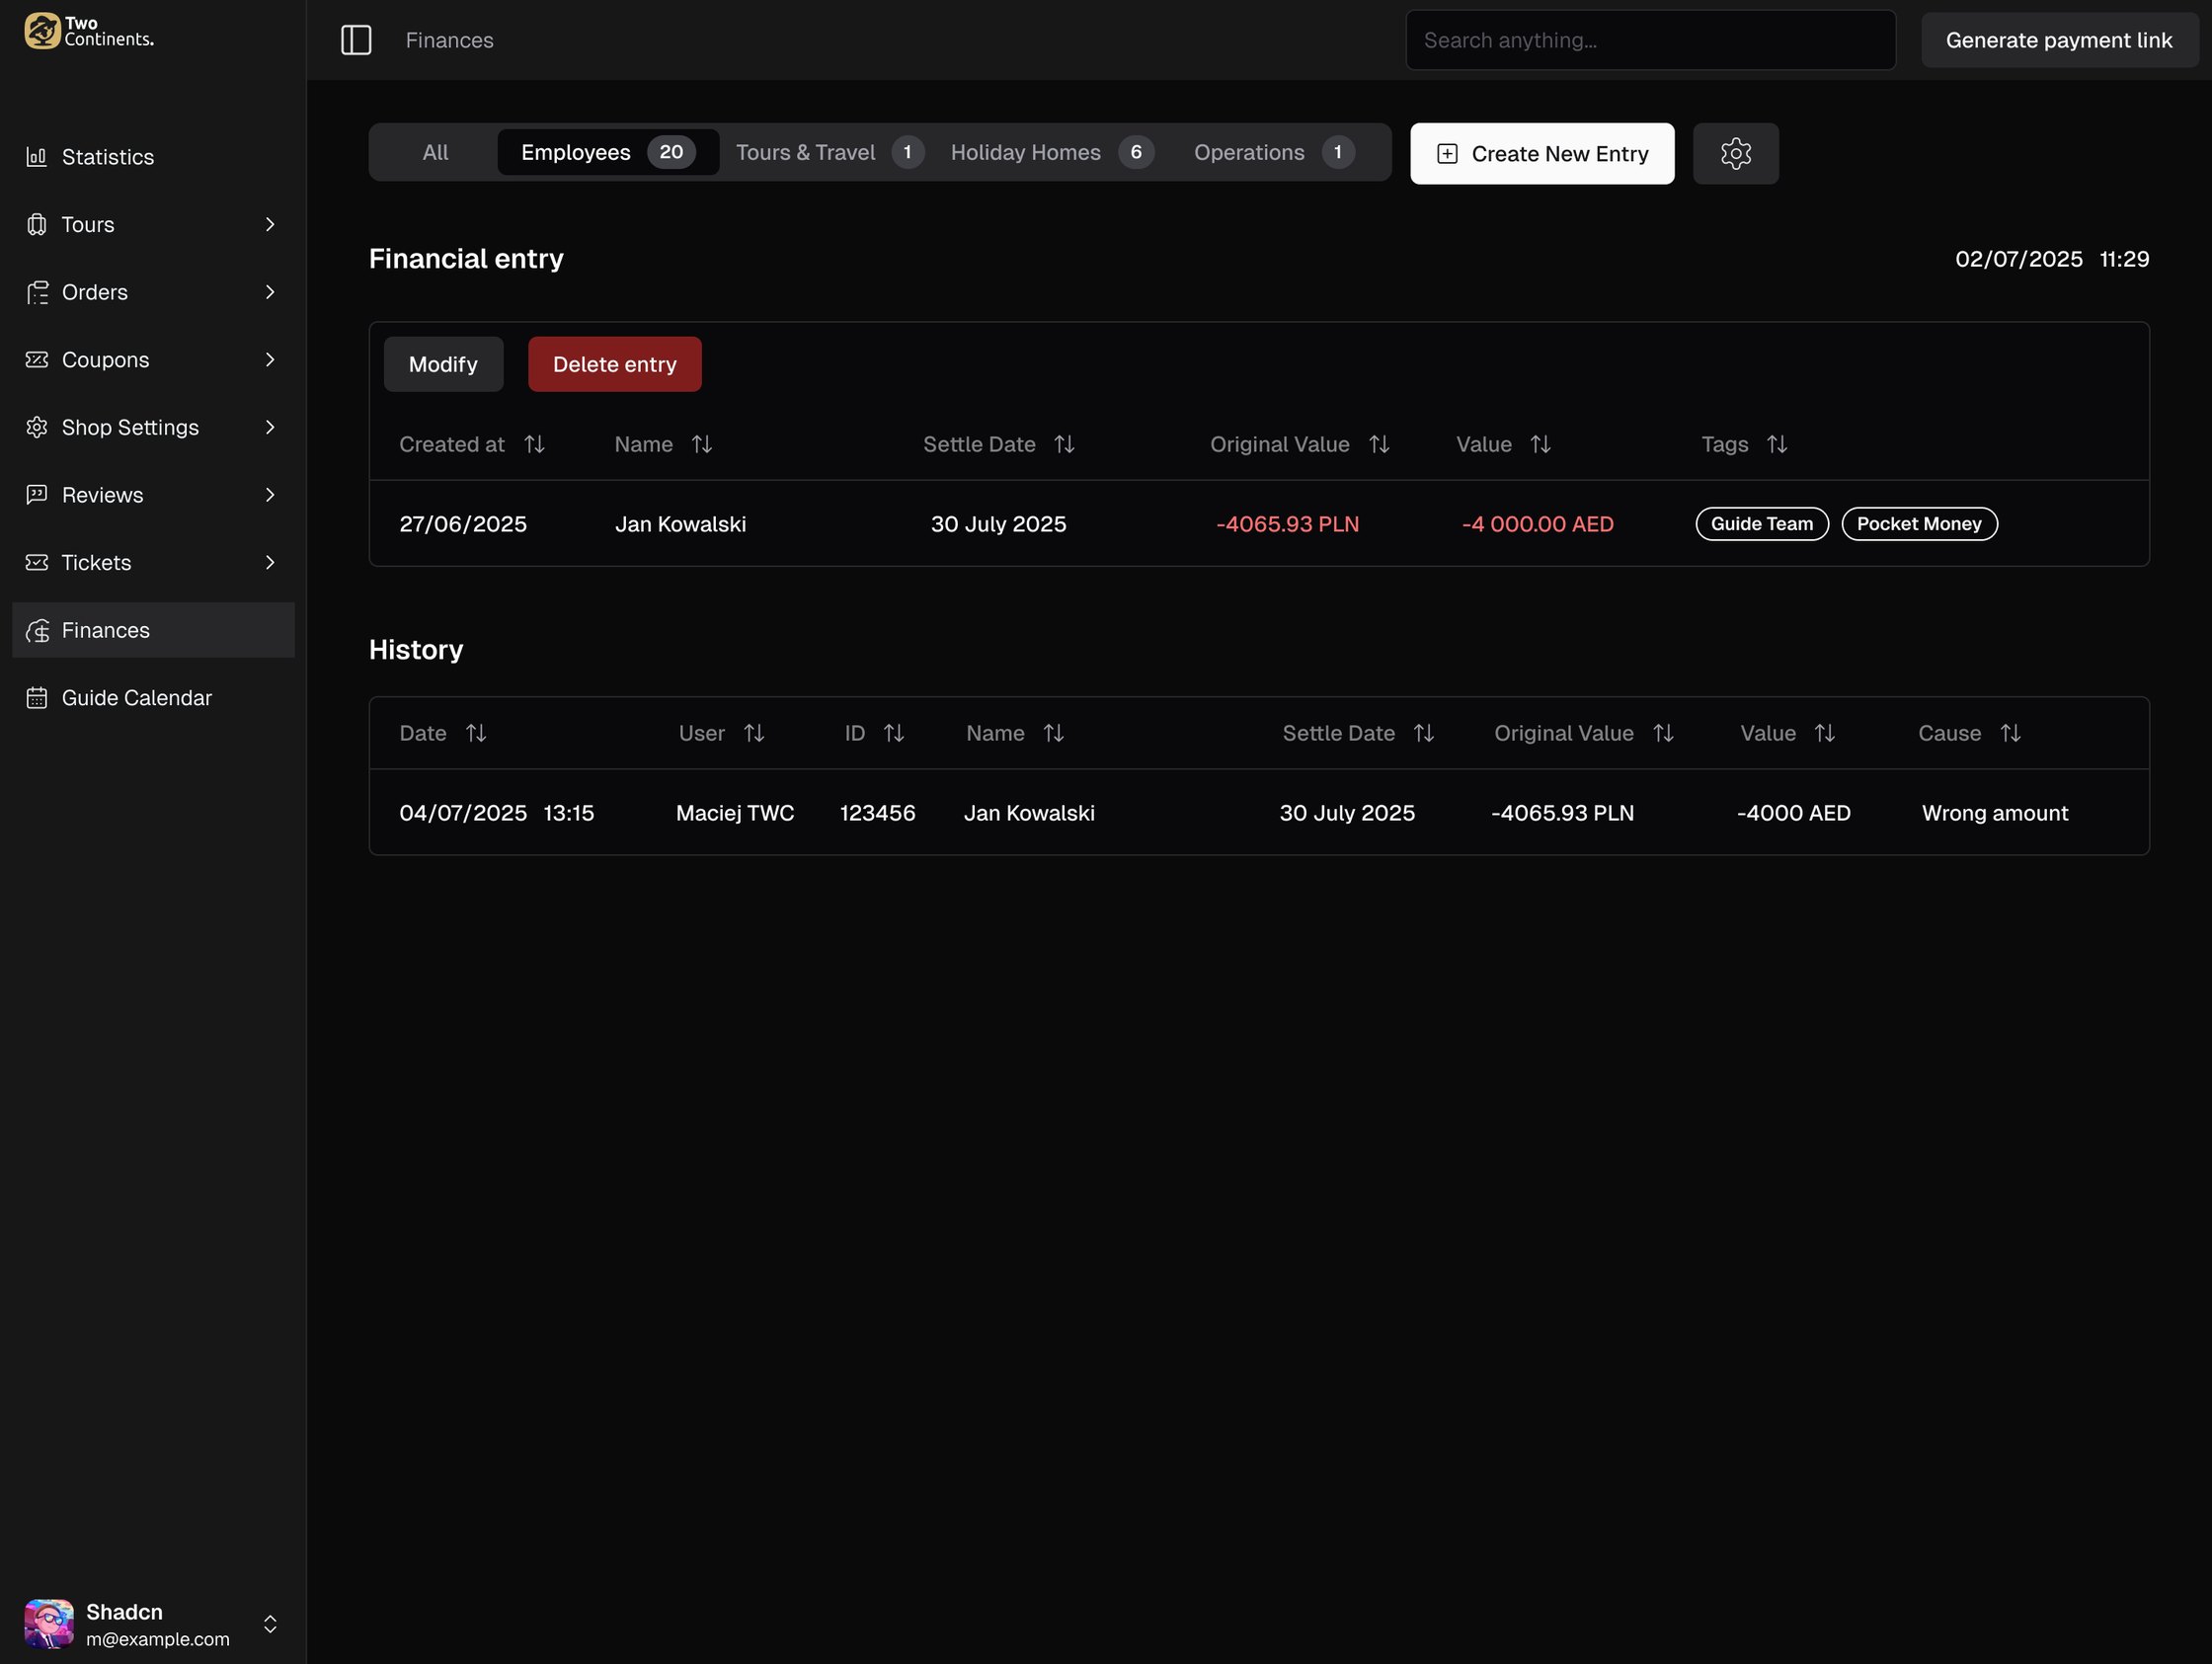
- Every correction is kept. An entry shows its history: who changed it, when, the original value and the reason.
- Reports export with the same filters as the table.
07 · The guides' side: attendance list
The office had the dashboard. Guides in the field needed the same tour data on their phones.
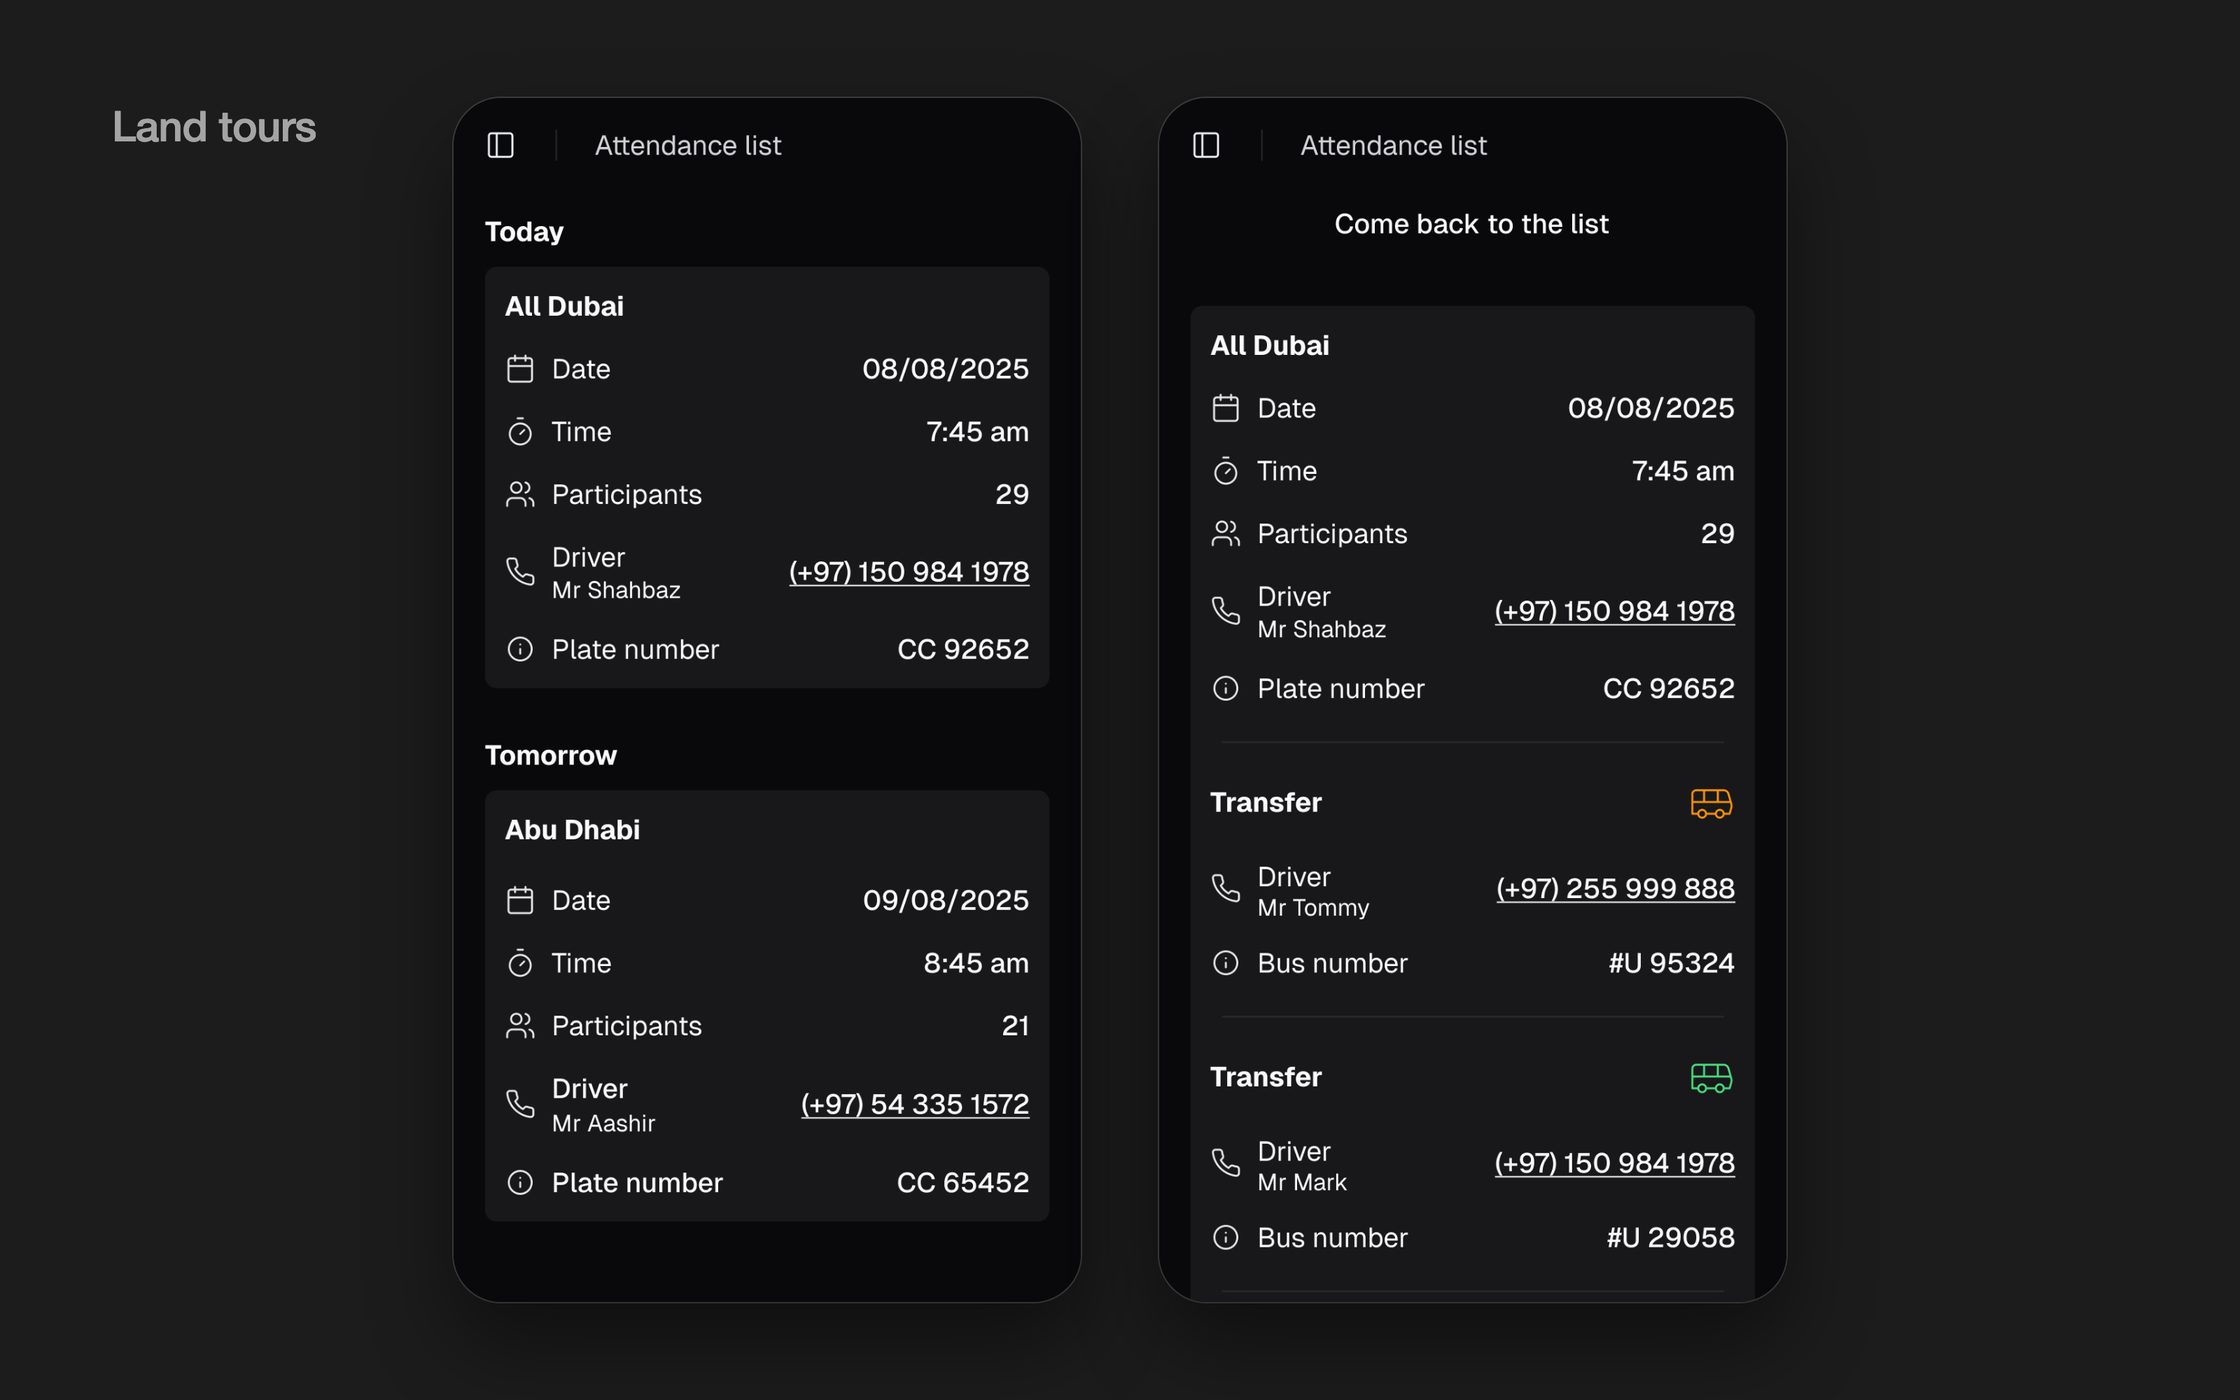
- Connected to the dashboard: tours, participants, drivers and transfers set up in the office appear on the guide's phone.
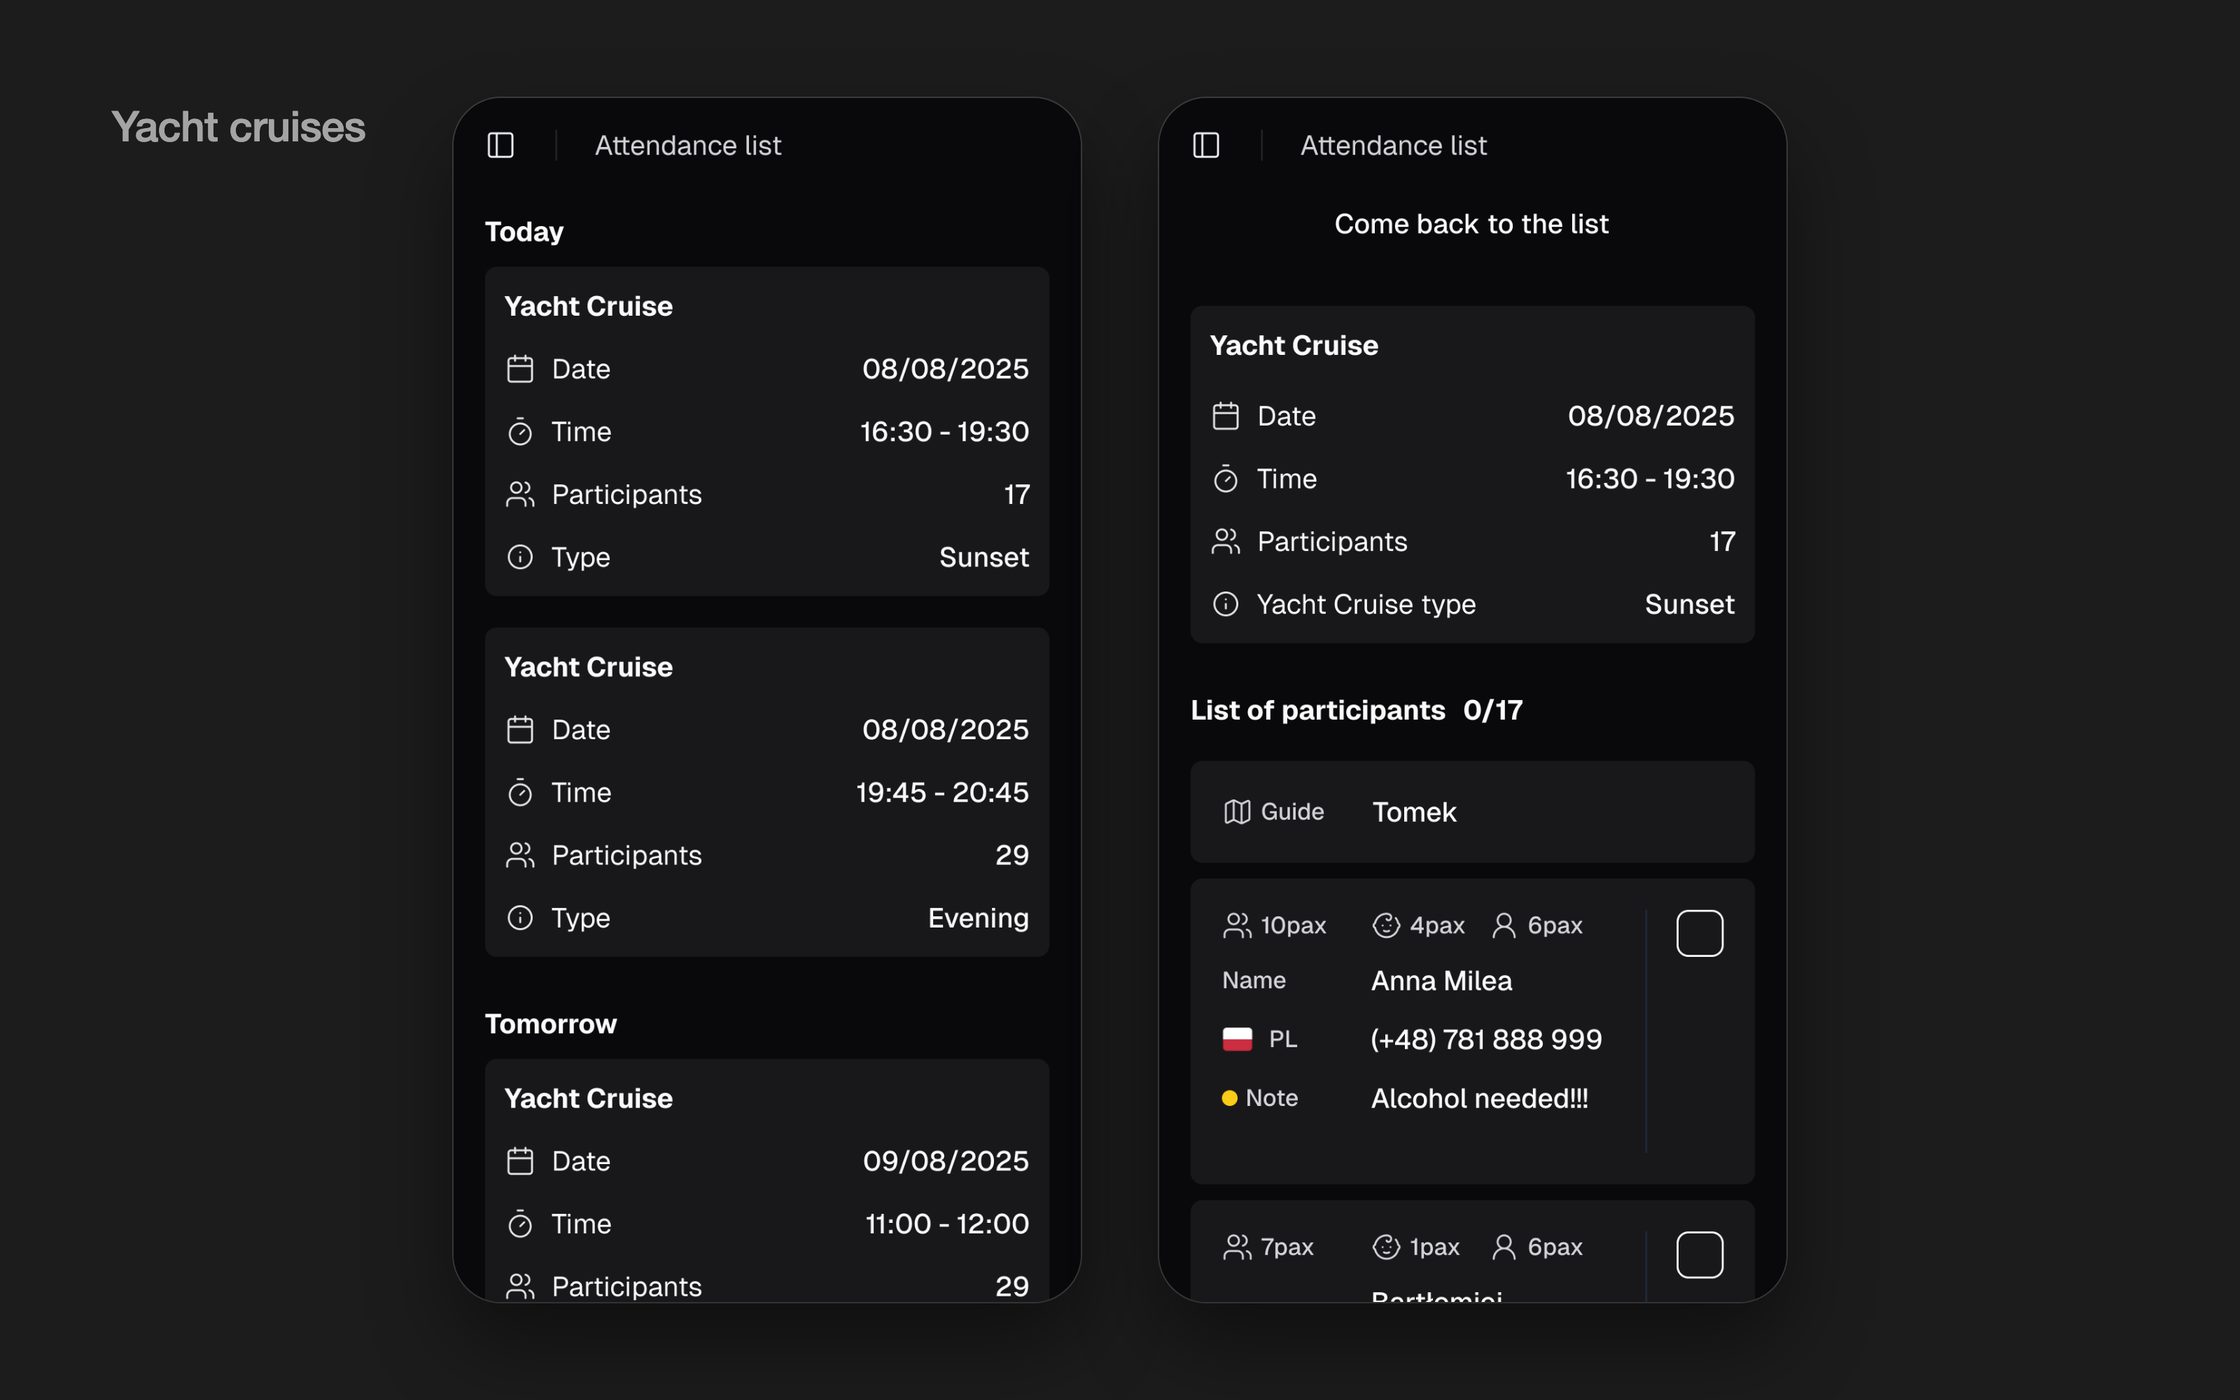
- Two kinds of tours on one list: yacht cruises with a participant list to tick off and notes such as special requests, and land tours with the driver, plate number, transfers and one tap to call the driver.
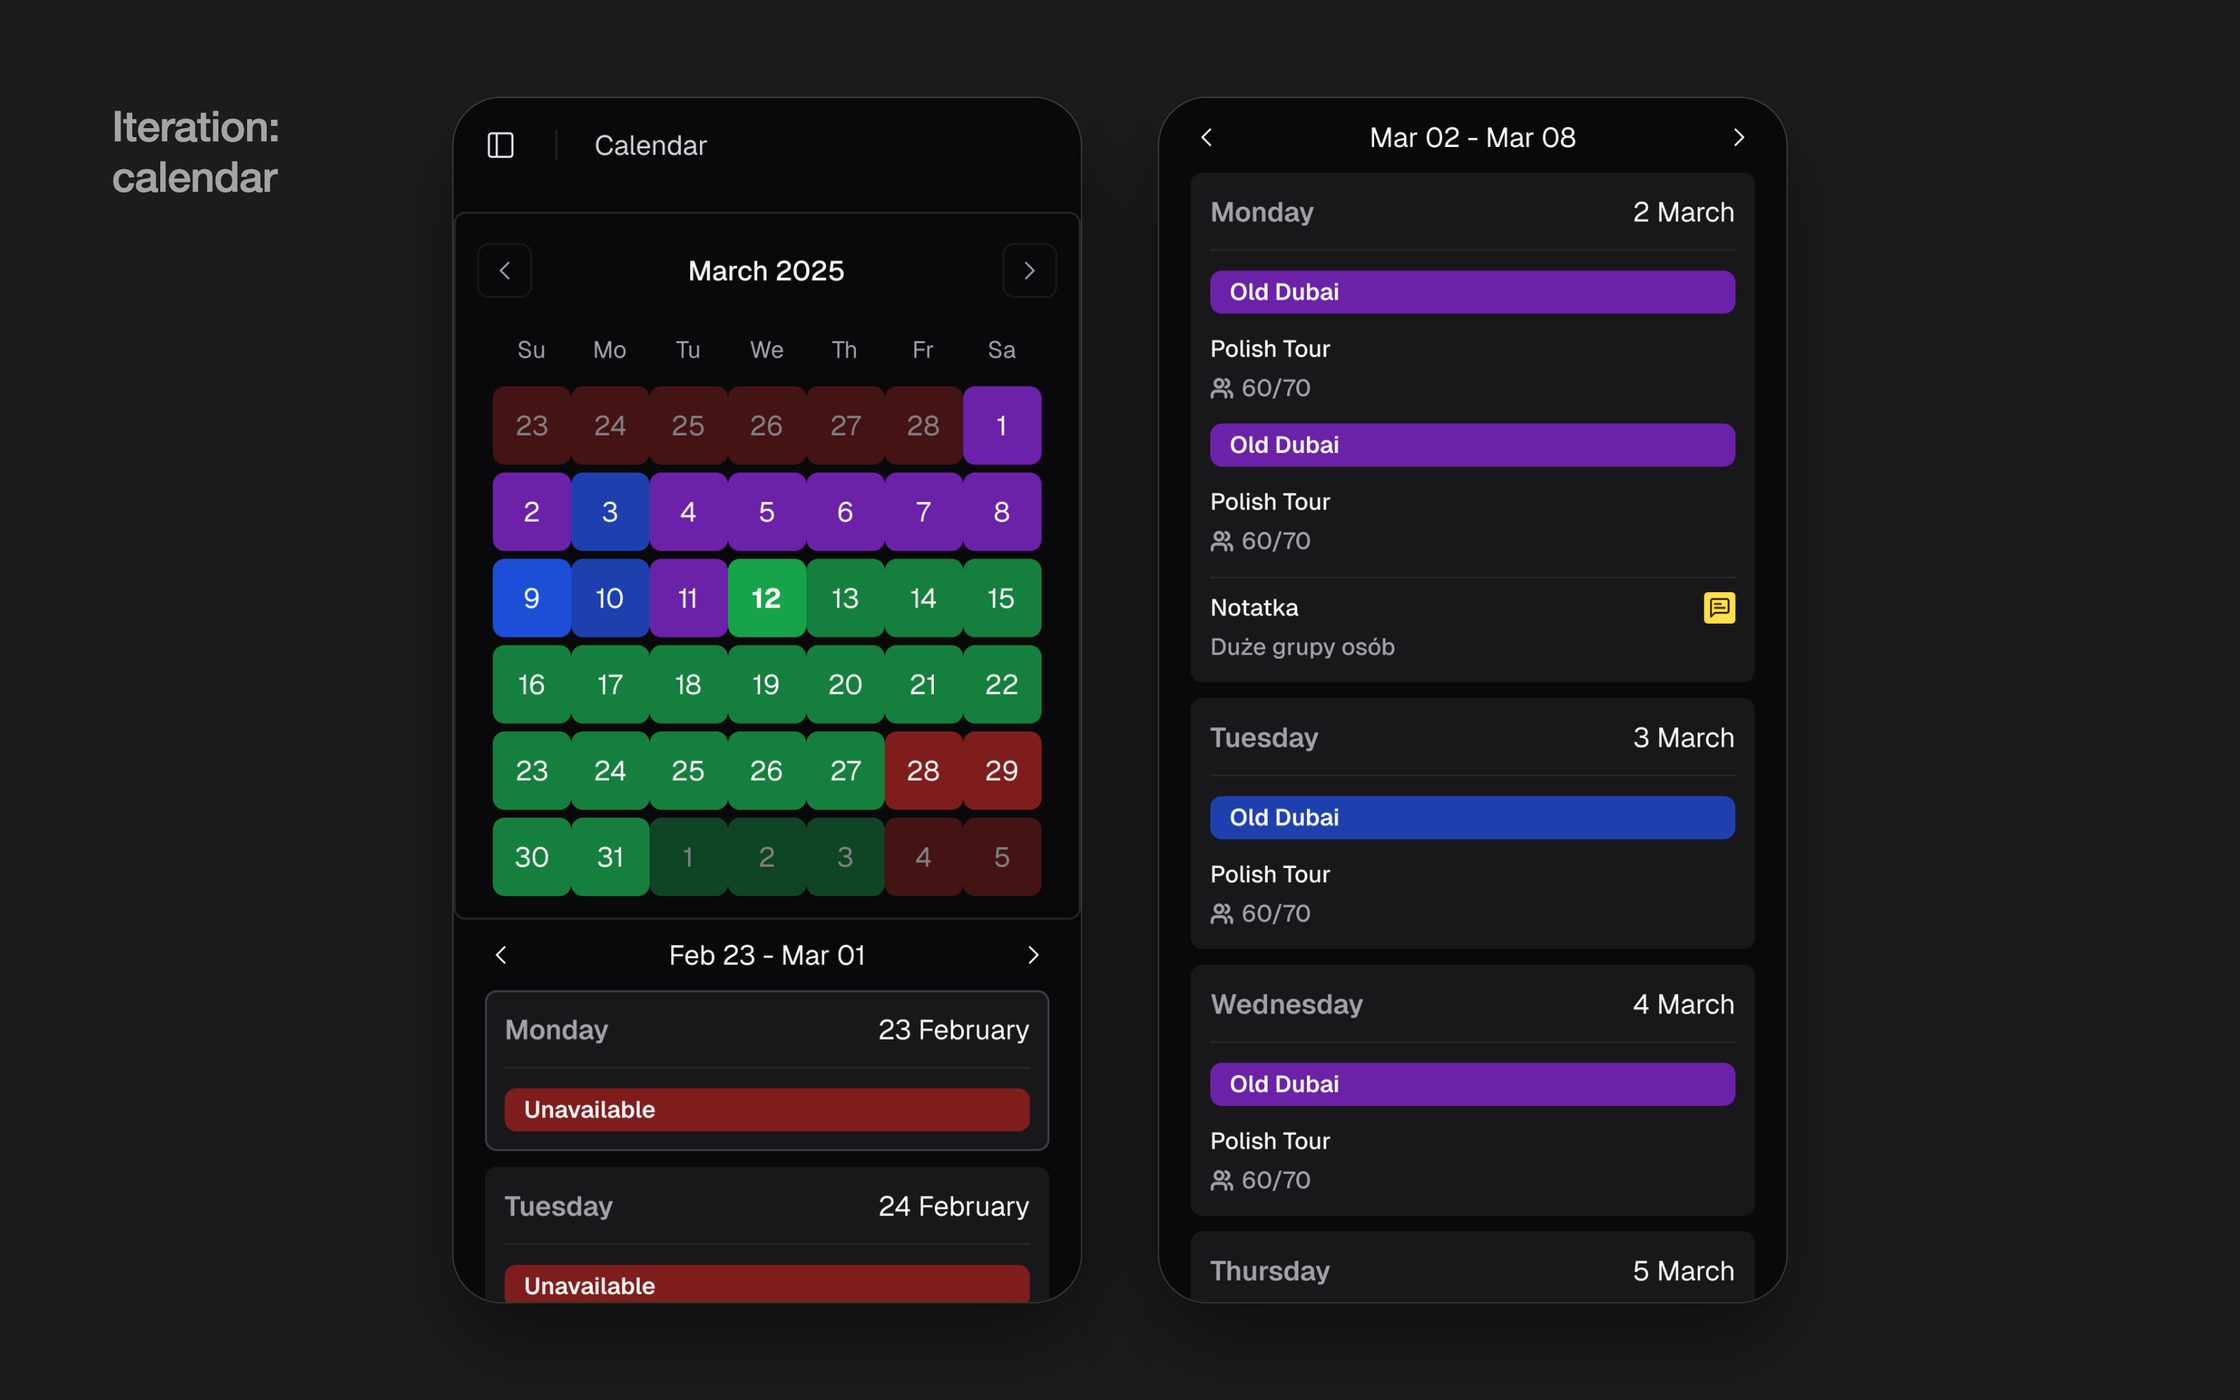
- Research: 1-on-1 interviews with 5 guides in Dubai. One iteration came out of them: a calendar.
- The calendar is fed straight from the Guide Calendar tab in the dashboard, where the office sees all guides. Tours are colour-coded by type, with unavailable days and notes.
Guides wanted the whole month in view, plus the next one, so they could plan their work and know where they stand.
08 · Influence
The biggest calls were made together with engineering, not handed over to them.
- A decision made together with engineering in a joint brainstorm: shadcn instead of a custom library. The tour management system in Dubai was outdated and the team needed changes live as fast as possible. The developers already knew shadcn, so the saved weeks went into the flow.
- Weekly UX/UI QA reviews with developers, every Friday, caught 40% more issues on dev, before they hit production.
- Paper sketching sessions with developers flagged the technically expensive steps. We changed two of them before they cost any dev time.
- Low-fi wireframes reviewed with engineering caught a data-model mismatch that would have cost a sprint later.
- The dashboard MVP went through usability testing with the employees who use it.
- The business didn't back my first proposal for the changes. Instead of pushing it through, I ran a card sorting workshop with the client in July 2025 to set a new direction together. It showed that my design didn't fully meet the project's original goals, so we simplified the flow before it was built and saved a lot of rework.
09 · Takeaways & Next Steps
Tour creation dropped from 30 to 3 minutes, and new employees now do it on their own. In usability tests of the MVP, staff called the flow more seamless and intuitive, and the client saw that the team could take on more orders. The company's finances moved from 13,798 pages of five entries into one log with a view for each category.
The strongest interview signal came from watching people work, not from asking what they wanted. Internal tools are full of hidden workarounds, and finding them is half the design. Next: the filters cut from the MVP, and onboarding time tracked as a continuous metric.